INTERMARKET REVIEW
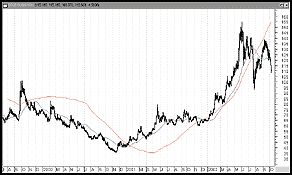
The AMEX GOLD BUGS INDEX ($HUI)

The AMEX Gold Bugs (basket of unhedged gold stocks) index represents shares of gold mining and production companies that do not engage in hedging their gold beyond 11-12 years. The index is designed to give investors better exposure to movements in the price of gold compared to other, broader indexes such as the Philadelphia Gold and Silver Index ($XAU).
Gold owners took much heart from what appeared to be a bottom in gold in autumn 2000. The Gold Bugs index traded under its 50- and 200-period moving averages for most of 2000, but began moving upward early in 2001, with the first half of 2002 being a true breakout period for the gold bugs. With the index up more than 200% two years after bottoming in 2000, the gold bull market has observers wondering whether gold's long-overdue comeback is at hand.
What they say: "It is fair to say that gold mining shares in this respect differ from other market sectors, where the predictability of outcomes has historically been highly valued. It suggests that the attempt by gold hedgers to introduce predictability, while well intentioned, has failed because it ignores the bedrock principle of all gold investors, stated at the outset: 'I buy a gold stock because I expect gold to go up.' The desire is for exposure to a rising gold price, whether or not that turns out to be the case." --John Hathaway, Tocqueville Asset Management. From "Do Investor Preferences Make Any Difference To The Performance And Valuation Of Gold Equities?," www.InvestAvenue.com, June 2002.
DOW JONES EQUITY REIT INDEX ($DJR)

The Dow Jones REIT Index is based on the performance of equity real estate investment trusts traded on the New York Stock Exchange, American Stock Exchange, and Nasdaq. Real estate investment trusts (REITS) are companies that own and/or operate income-generating real estate such as apartment buildings and office complexes.
Housing and real estate were the true winners of the stock market collapse in 2000. As measured by the Dow Jones Equity REIT Index, real estate investment trusts broke out in 2000, with the index moving above both the 50- and 200-period moving averages in the first half of that year. REITs continued to post strong gains into 2001 and into the first half of 2002. But after reaching a peak in the spring of 2002, REIT performance began to suffer. Note how the $Djr fell beneath both the 50- and 200-period moving averages in the summer of 2002.
What they say: " 'Wonderful' is a poor choice of words to describe the effect unprecedented mortgage borrowings will have on the American household sector. We can only hope that the damage caused by this year's speculative 'blow-off' within the Great Mortgage Finance Bubble is not the unmitigated disaster for the consumer sector that the 1999 telecom debt 'blow-off' has proved to be for the corporate sector." -- Doug Noland, financial markets strategist, David Tice and Associates. From "Coming Apart At The Seams," www.prudentbear.com, October 2002.
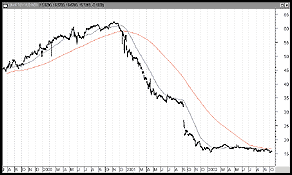
13-WEEK TREASURY BILL INDEX ($IRX)

The 13-week Treasury bill index is based on the discount rate of the most recently auctioned 13-week Treasury bill. The 13-week Treasury bill is one half of the equation used to derive the yield spread (along with the 30-year Treasury bond), which is a widely used measure of inflationary expectations.
The rising interest rates on short-term instruments in 1999 and into 2000 gave way suddenly and dramatically to the collapsing interest rate environment of 2001. With the Federal Reserve Board slashing the Fed funds rate from 6% in January 2001 to 1.75% by December, short-term securities like the 13-week Treasury bill saw amazing price appreciation -- and an equally amazing plummet in yields.
What they say: "Could the Fed do more? Yes, in my view, notably in reducing the pro-cyclicality of its regulatory oversight of bank credit risk; and further cuts in the Fed funds rate would be okay, too, even if likely to be a damp stimulative squib. More important, I think it would be extremely useful for Fed Chairman Greenspan to quit preaching at Congress about the need for fiscal discipline. É In the face of macroeconomic deflationary risk, extremism in the pursuit of monetary ease is no vice." -- Paul McCulley, fund manager and economist, Pimco Funds. From "Fed Focus," www.pimco.com, October 2002.
WILSHIRE 5000 INDEX ($WIL5)

The Wilshire 5000 is widely regarded as the "total stock market" index for the United States. This index provides the widest possible exposure to US-based, publicly traded equities. A companion index, the Wilshire 4500, includes only the small- and medium-capitalization stocks from the Wilshire 5000.
A superior representative of US stocks compared to the Dow industrials or Nasdaq, the Wilshire 5000 has nonetheless experienced the full effect of the equities bear market in the United States (and around the world, for that matter). With three major bear market troughs in the spring of 2001, the fall of 2001, and the summer and autumn of 2002, it appears that only lower prices are in store for equities for the foreseeable future.
What they say: "How much longer can the market downturn continue? To shed light on the issue, let's use history as a guide. Consider the worst downturn in US stock market history. The Dow Jones Industrial Average peaked on September 3, 1929; on the infamous 29th day of October, the market went into free fall. As the economic downturn ensued, the market collapse gathered steam, culminating in the Dow index reaching its low point on July 8, 1932. It took 1,039 days for the market to go from complete euphoria to utter despair." -- Tom Laming, chief equity strategist, Buffalo Funds. From "Investment Perspectives," August 2002.
Originally published in the January 2003 issue of Technical Analysis of STOCKS & COMMODITIES magazine. All rights reserved. © Copyright 2002, Technical Analysis, Inc.