January 2003
TRADERS' TIPS
You can copy these formulas and programs for easy use in your spreadsheet or analysis software. Simply "select" the desired text by highlighting as you would in any word processing program, then use your standard key command for copy or choose "copy" from the browser menu. The copied text can then be "pasted" into any open spreadsheet or other software by selecting an insertion point and executing a paste command. By toggling back and forth between an application window and the open Web page, data can be transferred with ease.
This month's tips include formulas and programs for:
AMIBROKER: THE MOVING TREND
AMIBROKER: A NONPARAMETRIC PERFORMANCE MEASURE
TRADESTATION: THE MOVING TREND
TRADESTATION: A NONPARAMETRIC PERFORMANCE MEASURE
eSIGNAL: THE MOVING TREND
Wealth-Lab: THE MOVING TREND
Wealth-Lab: A NONPARAMETRIC PERFORMANCE MEASURE
TradingSolutions: THE MOVING TREND
NEUROSHELL TRADER: THE MOVING TREND
NEUROSHELL TRADER: A NONPARAMETRIC PERFORMANCE MEASURE
NeoTicker: THE MOVING TREND
METASTOCK: THE MOVING TREND
SMARTrader: MOVING TREND
WALL STREET ANALYZER: THE MOVING TREND
AIQ: THE MOVING TREND
TECHNIFILTER PLUS: THE MOVING TREND
WAVE WI$E Market Spreadsheet: THE MOVING TREND
or return to January 2003 Contents
![]() AMIBROKER: THE MOVING TREND
AMIBROKER: THE MOVING TREND
Implementation of the moving trend indicator as described by William Rafter in his article in this issue, "The Moving Trend," is very straightforward and simple in AmiBroker 4.20. Its built-in LinearReg function allows calculation of the moving trend indicator in a single line of code.
In Listing 1 given here, you will find the formula that replicates the
display of moving averages versus moving trends, as presented in Rafter's
article.
It is also very easy to produce the surrogate bar chart from moving trend values. Appropriate code is included here in Listing 2.LISTING 1 MovTrend20 = LinearReg( Close, 20 ); // calculate moving trend // plot moving trend, moving average and price bars Plot( MovTrend20, "MovTrend-20", colorRed, styleThick ); Plot( MA( Close, 20 ), "MA-20", colorBlue, styleThick ); Plot( Close, "Price", IIf(Close > Open, colorDarkGreen, colorDarkRed), styleBar) ;
LISTING 2
mtOpen = LinearReg( Open, 20 ); // calculate moving trend from open
mtHigh = LinearReg( High, 20 ); // calculate moving trend from open
mtLow = LinearReg( Low, 20 ); // calculate moving trend from open
mtClose = LinearReg( Close, 20 ); // calculate moving trend from open
// plot surrogate chart
PlotOHLC( mtOpen, mtHigh, mtLow, mtClose, "Surrogate", colorBlack, styleCandle );
We can also visually compare the behavior of a moving trend to a
normalized Ehlers filter, as described in Rafter's article. The
following formula implements both:
LISTING 3
// Calculate normalized Ehlers filter (7-bar)
C1 = Ref( C, -1 ); C2 = Ref( C, -2 );
C3 = Ref( C, -3 ); C4 = Ref( C, -4 );
C5 = Ref( C, -5 ); C6 = Ref( C, -6 );
Ehlers =
-0.2632 * C6 - 0.1579 * C5 +
-0.0526 * C4 + 0.3158 * C3 +
 0.5789 * C2 + 0.4737 * C1 +
 0.1053 * C;
// Calculate moving trend 7-bar
MovTrend7 = LinearReg( Close, 7 );
// plot moving trend, moving average and price bars
Plot( Ehlers, "Ehlers", colorBlue, styleThick );
Plot( MovTrend7, "MovTrend", colorRed, styleThick );
Plot( Close, "Price", colorBlack, styleBar) ;
A downloadable version of all the formulas presented here
will be available from AmiBroker's website.
Figure 1 shows a moving average versus a moving
trend that was plotted using the first formula.

Figure 1: AMIBROKER, MOVING TREND VS. MOVING AVERAGE. This AmiBroker chart shows a moving average plotted along with a moving trend.
--Tomasz Janeczko
amibroker.com
![]() AMIBROKER: A NONPARAMETRIC PERFORMANCE MEASURE
AMIBROKER: A NONPARAMETRIC PERFORMANCE MEASURE
The nonparametric performance measure (ACC) described by Guy Brys and Luc Van Hof in "A Nonparametric Performance Measure" in this issue could be used to evaluate the performance of any trading system.
Calculating ACC involves ranking and sorting daily MAE and PAE figures. These tasks could be relatively easily implemented in AmiBroker using JScript embedded in the native AFL formula. In the sample code given here, we calculate the ACC of a simple directional movement indicator system, but as the authors mention in the article, the ACC measure can be applied to any system.
One interesting point to note about this implementation is that it uses JScript's built-in sort function with custom callback to sort by absolute value of the difference between the PAE and MAE figures.
The screenshot in Figure 2 shows the results of exploration over the group of symbols, with the rightmost column displaying calculated ACC values of the sample ADX system for each stock from the basket.

Figure 2: AMIBROKER, NONPARAMETRIC PERFORMANCE MEASURE. Here are sample results of an exploration over a group of symbols. The rightmost column displays calculated ACC values of the sample ADX system for each stock from the basket.
A downloadable formula will be available from the AmiBroker website.
LISTING 1
// The trading system for which we want
// to calculate nonparametric performance measure
// here as an example ADX system
pr = Optimize( "pr", 25, 5, 50, 1 );
Buy = ADX(pr) > 10 AND Cross( PDI(pr), MDI(pr) );
Sell = Cross( MDI(pr), PDI(pr) );
Short = ADX(pr) > 10 AND Cross( MDI(pr), PDI(pr) );
Cover = Cross( PDI(pr), MDI(pr) );
// MAIN PART:
// Calculation of Nonparametric
// Performance Measure
//
// First we calculate Equity
e = Equity( 1 );
Entry = Buy OR Short;
// ... and excursion (the difference between current equity
// and value of equity at entry
Excursion = e - ValueWhen( Entry, e );
// determine start and end intraday bar of the day
StartOfDay = DateNum() != Ref( DateNum(), -1 );
EndOfDay = Ref( StartOfDay, 1 );
//
// calculate daily maximum MAE, PAE and DAE
MAE = HighestSince( StartOfDay, Max( -Excursion, 0 ) );
PAE = HighestSince( StartOfDay, Max( Excursion, 0 ) );
DAE = PAE - MAE;
// number of days that intraday data span
NumDays = LastValue( Cum( EndOfDay ) );
EnableScript("JScript");
<%
// compare function for JScript sort
// we will be sorting by absolute value
function CmpFun( x, y )
{
  return Math.abs(x) - Math.abs(y);
}
// get variables from AFL part
NumDays = AFL("NumDays");
DAE = VBArray( AFL("DAE") ).toArray();
EndOfDay = VBArray( AFL("EndOfDay") ).toArray();
// now we build small array
// from DAE values at the end of day
//
nday = 0;
SortedDAE = new Array();
for( i = 0; i < DAE.length; i++ )
 if( EndOfDay[ i ] == 1 ) SortedDAE[ nday++ ] = DAE[ i ];
// sort the array by absolute value of DAE
SortedDAE.sort( CmpFun );
// after sorting RAE is simply array index + 1
// SAE is index + 1 with appropriate sign depending on DAE value
// but for ACC we just sum only positve SAEs
SumSAE = 0; SumRAE = 0;
for( i = 0; i < nday; i++ )
{
   RAE = i + 1;
   SumRAE += RAE;
   if( SortedDAE[ i ] >= 0 ) SumSAE += RAE;
}
AFL("ACC") = SumRAE > 0 ? 1 - (SumSAE/SumRAE) : 0;
%>
// now ACC variable holds nonparametric performance estimator
// Exploration code
Filter = Status("LastBarInRange") OR EndOfDay;
AddColumn(MAE,"MAE");
AddColumn(PAE,"PAE");
AddColumn(DAE,"DAE");
AddColumn(abs(DAE),"AbsDAE");
AddColumn(ACC, "ACC-Nonparametric Performance Estimator" );
--Tomasz Janeczko
amibroker.com
![]() TRADESTATION:
THE MOVING TREND
TRADESTATION:
THE MOVING TREND
William Rafter's article "The Moving Trend" in this issue provides a description and commentary on using linear regression to create a nonlagging smoothing filter. This indicator can be drawn on a TradeStation screen by using the built-in indicator time series forecast.
This indicator has two inputs, length and BarsPlus. Length describes the length of the average. BarsPlus describes the desired offset from the current bar. For example, if BarsPlus is set to zero, the indicator will return a value for the current bar that equals the linear regression forecast for this bar using the previous number of data samples defined by length's value. If length is 20 and BarsPlus is 10, the resulting value will be the linear regression value produced for the data value 10 bars ago. In this case, the value will match that of the simple average, since the calculated mean will approximately equal the regression value halfway through the data. This demonstrates the lag incurred by plotting a mean at the end of the data sample. To get the forecasted value for the next bar, enter "-1" for the BarsPlus value.
Figure 3 replicates Rafter's Microsoft chart using this time
series forecast indicator. The 20-bar average is shown in light blue. The
time series forecast indicator is in red.

Figure 3: TRADESTATION, MOVING TREND. Here's a sample TradeStation chart demonstrating TradeStation's time series forecast indicator, which can be used to replicate the technique described by William Rafter to create a nonlagging smoothing filter. The time series forecast indicator is plotted along with a moving average. The 20-bar average is shown in light blue; the time series forecast indicator is in red.
-- Mark MillsGO BACK
EasyLanguage Specialist
TradeStation Technologies, Inc. (formerly Omega Research, Inc.)
A subsidiary of TradeStation Group, Inc.
www.TradeStation.com, www.TradeStationWorld.com
![]() TRADESTATION:
A NONPARAMETRIC PERFORMANCE MEASURE
TRADESTATION:
A NONPARAMETRIC PERFORMANCE MEASURE
The article "A Nonparametric Performance Measure" by Guy Brys and Luc Van Hof in this issue describes four generalized indicators and two performance measures.
Here is the TradeStation 6 code for all four indicators and a performance measure strategy that will display both performance measures. The performance measure strategy must be inserted in a chart with an existing trading strategy.
Figure 4 shows the four indicators and the two performance measures (reported in the chart's upper right-hand corner). The trading strategy used was a simple crossover scheme of the OHLC (open-high-low-close) and a smoothed OHLC.
Figure 4: TRADESTATION, NONPARAMETRIC MEASURE. Here's a sample TradeStation chart based on Guy Brys and Luc Van Hof's article in this issue. It shows the four indicators and the two performance measures (reported in the chart's upper right-hand corner). The trading strategy used was a simple crossover scheme of the OHLC (open-high-low-close) and a smoothed OHLC.
Indicator: OHLC
inputs:
S1( 10 ),
S2( 10 ),
S3( 10 ) ;variables:
Numerator( 0 ),
Denominator( 0 ),
Fraction( 0 ) ;Numerator = XAverage( Close - Open, S1 ) ;
Denominator = XAverage( High - Low, S2 ) ;
Fraction =
iff( Denominator > .001
or Denominator < -.001,
XAverage( Numerator / Denominator , S3 ), 0 ) ;Plot1( Fraction, "OHLC" ) ;
Plot2( 0 ) ;Indicator: GADX
inputs:
S1( 10 ),
S2( 20 ),
S3( 10 ) ;
variables:
Numerator( 0 ),
Denominator( 0 ),
Fraction( 0 ),
DMpos( 0 ),
DMneg( 0 ),
Delta1( 0 ),
Delta2( 0 ),
RawFraction( 0 ) ;DMpos = MaxList( High - High[1], 0 ) ;
DMneg = MaxList( Low[1] - Low, 0 ) ;
if DMpos >= DMneg then
begin
Delta1 = 1 ;
Delta2 = 0 ;
end
else
begin
Delta1 = 0 ;
Delta2 = 1 ;
end;
Value1 = DMpos * Delta1 ;
Value2 = DMneg * Delta2 ;
Numerator =
XAverage( Value1 - Value2, S1 ) ;
Denominator =
XAverage( Value1 + Value2, S2 ) ;
RawFraction =
iff( Denominator = 0, 0, Numerator / Denominator ) ;
Fraction = XAverage( RawFraction, S3 ) ;Plot1( Fraction, "GADX" ) ;
Plot2( 0 );Indicator: GDTI
inputs:
S1( 20 ),
S2( 20 ),
S3( 10 ) ;variables:
Numerator( 0 ),
Denominator( 0 ),
Fraction( 0 ),
DMpos( 0 ),
DMneg( 0 ),
Delta1( 0 ),
Delta2( 0 ),
RawFraction( 0 ) ;DMpos = MaxList( High - High[1], 0 ) ;
DMneg = MaxList( Low[1] - Low, 0 ) ;Value1 = DMpos - DMneg ;
Numerator = XAverage( Value1, S1 ) ;
Denominator = XAverage( AbsValue( Value1 ), S2 ) ;
RawFraction =
iff( Denominator = 0, 0, Numerator / Denominator ) ;
Fraction = XAverage( RawFraction, S3 ) ;Plot1( Fraction, "GDTI" ) ;
Plot2( 0 );Indicator: SFPV
inputs:
S1( 20 ),
S2( 20 ),
S3( 10 ) ;variables:
Numerator( 0 ),
Denominator( 0 ),
HH( 0 ),
LL( 0 ),
Fraction( 0 ),
RawFraction( 0 ) ;HH = Highest( High, S1 ) ;
LL = Lowest( Low, S2 ) ;
Numerator = XAverage( High + Low - ( HH + LL ), S1 ) ;
Denominator = XAverage( HH - LL, S2 ) ;
RawFraction =
iff( Denominator = 0, 0, Numerator / Denominator ) ;
Fraction = XAverage( RawFraction, S3 ) ;Plot1( Fraction, "SFPV" ) ;
Plot2( 0 );
Strategy: NonParametricMeasure
{ Assumes daily bars and use of TradeStation 6 }
inputs:
VertAdj( 20 ) ;variables:
Index( 0 ),
RAEsum( 0 ),
SAEsum( 0 ),
MaxDrawDown( 0 ),
ROA( 0 ),
ACC( 0 ),
InitialPassDone( false ) ;arrays:
DAEarray[ 2, 1000 ]( 0 ) ;
{raw number in column 2, abs value in column 1}if ( MarketPosition <> 0 and Index < 1000 ) then
begin
Index = Index[1] + 1 ;
DAEarray[ 2, Index ] =
MaxPositionProfit + MaxPositionLoss ;
DAEarray[ 1, Index ] =
AbsValue( DAEarray[ 2, Index ] ) ;
end ;if LastBarOnChart and InitialPassDone = false then
{Only do this when backtesting, not for live data }
begin
InitialPassDone = true ;
Value1 = Sort2DArray( DAEarray, 2, 1000, -1 ) ;
{Sort descending, matching big numbers & big index}
for Value1 = Index downto 1
begin
SAEsum = SAEsum + iff( DAEarray[ 2, Value1 ]
> 0, 1, 0 ) * Value1 ;
RAEsum = RAEsum + Value1 ;
end ;
ACC = 1 - SAEsum / RAEsum ;
ROA = -NetProfit / MaxIDDrawDown ;
Value2 = Text_New( Date[20], Time[20],
High + VertAdj, "ACC " + NumToStr( ACC, 2 ) ) ;
Value2 = Text_New( Date[10], Time[10],
High + VertAdj, "ROA " + NumToStr( ROA, 2 ) ) ;
end ;
This indicator and strategy code will be available for download
from the EasyLanguage Exchange on www.tradestationworld.com.
-- Mark Mills, EasyLanguage Specialist
TradeStation Technologies, Inc. (formerly Omega Research, Inc.)
A subsidiary of TradeStation Group, Inc.
www.TradeStation.com, www.TradeStationWorld.com
![]() eSIGNAL:
THE MOVING TREND
eSIGNAL:
THE MOVING TREND
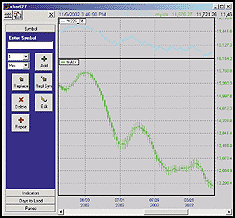
This eSignal formula is based on "The Moving Trend" by William Rafter in this issue. A sample chart is in Figure 5.

Figure 5: eSIGNAL, MOVING TREND. This sample eSignal chart plots the moving trend study described by William Rafter.
/***********************************************************************
Copyright © eSignal, a division of Interactive Data Corporation.
2002. All rights reserved. This sample eSignal Formula Script (EFS)
may be modified and saved under a new filename; however, eSignal is no
longer responsible for the functionality once modified. eSignal reserves
the right to modify and overwrite this EFS file with each new release.
***********************************************************************/
GO BACKfunction preMain() { setStudyTitle("Movtrend"); setCursorLabelName("Movtrend", 0); setDefaultBarFgColor(Color.blue, 0); setPriceStudy(true); } function main(n) { if(n == null) n = 20; var sum = 0; var i = 0; var mt = 0; for(i = n; i > 0; i--) sum += (i - (n + 1) / 3) * close(i - n); wt = 6 / (n * (n + 1)) * sum return wt; }
--eSignal, a division of Interactive Data Corp.
800 815-8256, www.esignal.com
![]() Wealth-Lab: THE MOVING TREND
Wealth-Lab: THE MOVING TREND
The moving trend indicator presented by William Rafter in this issue can be implemented in Wealth-Lab through the built-in linear regression indicator. Here, we present a script that displays the 20-day moving trend and a 20-day moving average for comparison.
We've also included a simple trading system. The system looks for cases where prices have moved a considerable distance (at least 7%) below the moving trend value. We go long and bet that prices will correct. The system exits using a limit order, the limit price based on the current value of the moving trend.
As you can see from the chart of PMCS in Figure 6, this strategy can yield many profitable trades. The system also holds up to a portfolio-level test. Figure 7 shows a portfolio equity curve trading the system on the Nasdaq 100 stocks. Starting capital of $100,000 was used, and a position sizing rule of 5% of current equity per position. Commissions of $10 per trade were deducted. The equity curve follows the rise of the overall bull market, but continues to rise after the Nasdaq 100 (blue line) peaks and starts to decline.

Figure 6: Wealth-Lab, MOVING TREND. As you can see from this chart of PMCS, William Rafter's strategy can yield many profitable trades.
Figure 7: Wealth-Lab, MOVING TREND. This Wealth-Lab chart shows a portfolio equity curve trading the system on the Nasdaq 100 stocks. The equity curve follows the rise of the overall bull market, but continues to rise after the Nasdaq 100 (blue line) peaks and starts to decline.
You can tune this system by modifying the factor used for entry.
By increasing the position sizing rule to 7%, you will wind up with fewer
trades, but those trades will have a higher likelihood of being profitable.
Decreasing the threshold will result in more trading opportunities. You
can also add a trend detection mechanism and reverse the signal to go short
in a downward trending market.
var MOVTREND, MOVAVG, BAR: integer;
MovTrend := LinearRegSeries( #Close, 20 );
MovAvg := SMASeries( #Close, 20 );
PlotSeries( MovTrend, 0, #Navy, #Thick );
PlotSeries( MovAvg, 0, #Gray, #Thin );
for Bar := 20 to BarCount - 1 do
begin
  if MarketPosition = 0 then
  begin
    if @MovTrend[Bar] / PriceClose( Bar ) > 1.07 then
      BuyAtMarket( Bar + 1, '' );
  end
  else
  begin
    SellAtLimit( Bar + 1, @MovTrend[Bar], LastPosition, '' );
  end;
end;
--Dion Kurczek, Wealth-Lab, Inc.
www.wealth-lab.com
![]() Wealth-Lab: A NONPARAMETRIC PERFORMANCE MEASURE
Wealth-Lab: A NONPARAMETRIC PERFORMANCE MEASURE
This Wealth-Lab script calculates the Wilcoxon signed-rank test on the
signals generated from a simple oscillator-based trading system on 15-minute
bar data. The script illustrates the object-oriented programming capability
of our WealthScript language by creating a new Object type to store the
data for a single trading system signal. The Object contains data fields
for Max Favorable Excursion, Max Adverse Excursion, Difference, Abs( Difference
), Rank and Signed Rank. A sample can be found in Figure 8.

Figure 8: Wealth-Lab, NONPARAMETRIC PERFORMANCE MEASURE. Here is a sample chart of the nonparametric performance measure.
Whenever a trading system position is closed, an instance of the
Object is created and stored in a list. When the system completes processing,
the list is sorted by Abs( Difference ), after which the rank and signed
rank fields are assigned values. The Wilcoxon signed-rank test is computed
by summing the signed ranks. The script also prints the contents of the
Objects to the Debug Window for detailed analysis (Figure 9).

Figure 9: Wealth-Lab, NONPARAMETRIC PERFORMANCE MEASURE. The Wealth-Lab script for the nonparametric performance measure also prints the contents of the Objects to the Debug Window for detailed analysis.{ Create an Object Type to hold a sample value } type TSample = class( TObject ) private protected public MAE: float; MFE: float; Diff: float; AbsDiff: float; Rank: integer; SignedRank: integer; end; { Variables } const FMT = '#0.00'; var Indicator, Wilcoxon, BAR, i, sign: integer; var Profit, MAE, MFE: float; var lst: TList; var samp: TSample; var s: string; { Initialization } MAE := 9999; MFE := -9999; lst := TList.Create; { Plot the Indicator } Indicator := CMOSeries( #Close, 14 ); PlotSeries( Indicator, CreatePane( 100, true, true ), #Blue, #Thick ); { Trading System } for Bar := 20 to BarCount - 1 do begin if not LastPositionActive then begin if CrossOverValue( Bar, Indicator, -50 ) then BuyAtMarket( Bar + 1, '' ); end else begin Profit := PositionOpenProfitPct( Bar, LastPosition ); if Profit > MFE then MFE := Profit; if Profit < MAE then MAE := Profit; if CrossUnderValue( Bar, Indicator, 50 ) then SellAtMarket( Bar + 1, LastPosition, '' ); { When a position is closed create our sample } if not LastPositionActive then begin samp := TSample.Create; samp.MFE := MFE; samp.MAE := Abs( MAE ); samp.Diff := samp.MFE - samp.MAE; samp.AbsDiff := Abs( samp.Diff ); { Add sample to list } lst.AddObject( samp.AbsDiff, samp ); { Reset values } MAE := 9999; MFE := -9999; end; end; end; { Sort the list by absolute differences } lst.SortNumeric; { Calculate Wilcoxon Signed-Rank Test } Wilcoxon := 0; for i := 0 to lst.Count - 1 do begin samp := TSample( lst.Object( i ) ); samp.Rank := i + 1; if samp.Diff < 0 then samp.SignedRank := -samp.Rank else samp.SignedRank := samp.Rank; Wilcoxon := Wilcoxon + samp.SignedRank; end; { Display Wilcoxon Signed-Rank Test Value on Chart } DrawText( 'Wilcoxon Signed-Rank Test: ' + IntToStr( Wilcoxon ), 0, 4, 44, #Blue, 12 ); { Dump Object values to Debug Window } s := 'MFE' + #9 + 'MAE' + #9 + 'Diff' + #9 + 'AbsDiff' + #9 + 'Rank' + #9 + 'Signed Rank'; Print( s ); for i := 0 to lst.Count - 1 do begin samp := TSample( lst.Object( i ) ); s := FormatFloat( FMT, samp.MFE ) + #9 + FormatFloat( FMT, samp.MAE ) + #9 + FormatFloat( FMT, samp.Diff ) + #9 + FormatFloat( FMT, samp.AbsDiff ) + #9 + IntToStr( samp.Rank ) + #9 + IntToStr( samp.SignedRank ); Print( s ); end; s := 'Wilcoxon Signed-Rank Test:' + #9#9#9 + IntToStr( Wilcoxon ); Print( s );
--Dion Kurczek, Wealth-Lab, Inc.
www.wealth-lab.com
![]() TradingSolutions: THE MOVING TREND
TradingSolutions: THE MOVING TREND
In his article "The Moving Trend," William Rafter writes about the "moving trend" data smoothing operation.
The moving trend (movtrend) is described as being the value of a least-squares regression for today. Functions for calculating this regression are included with TradingSolutions in the Statistical Functions group under the name "linear regression."
Movtrend can be calculated using the linear regression indicator function. This same function is also available in the Series Averaging Functions group as "Moving Average (Time Series)." The slope value listed in the article's sidebar as "a" can be calculated using the linear regression slope function. The intercept value listed in the article's sidebar as "b" can be calculated using the linear regression intercept function.
Calculations associated with the John Ehlers' "Zero-Lag Data Smoothers" article (July 2002 S&C) are available in a function file that can be downloaded from the TradingSolutions website (www.tradingsolutions.com) in the Solution Library section.
--Gary Geniesse, NeuroDimension, Inc.
800 634-3327, 352 377-5144
www.tradingsolutions.com
![]() NEUROSHELL TRADER: THE MOVING TREND
NEUROSHELL TRADER: THE MOVING TREND
To recreate William Rafter's moving trend indicator in NeuroShell Trader, select "New Indicator ..." from the Insert menu and use the Indicator Wizard to enter the following:
Subtract ( LinTimeReg PredValue ( Close, 5, 1 ), LinTimeReg Slope ( Close, 5, 1 )
A sample chart of the moving trend is in Figure 10.
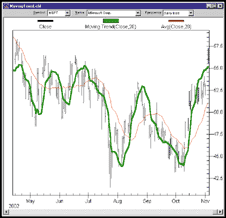
Figure 10: NEUROSHELL TRADER, MOVING TREND INDICATOR. Here's a sample NeuroShell Trader chart demonstrating William Rafter's moving trend indicator .
Users of NeuroShell Trader can go to the STOCKS & COMMODITIES
section of the NeuroShell Trader free technical support website to download
a sample moving trend chart that includes the moving trend custom indicator.
--Marge Sherald, Ward Systems Group, Inc.
301 662-7950, sales@wardsystems.com
www.neuroshell.com
![]() NEUROSHELL TRADER: A NONPARAMETRIC PERFORMANCE
MEASURE
NEUROSHELL TRADER: A NONPARAMETRIC PERFORMANCE
MEASURE
The nonparametric performance measure described by Guy Brys and Luc Van Hoff can be easily implemented in NeuroShell Trader by using NeuroShell Trader's ability to call external Dynamic Linked Libraries. Dynamic Linked Libraries can be written in C, C++, Power Basic (also Visual Basic using one of our add-on packages), and Delphi.
We've created an ACC nonparametric performance measure indicator that you can download from the NeuroShell Trader free technical support website. The ACC indicator we've provided can be applied to any trading strategy created with the NeuroShell Trader.
After downloading the custom indicator and creating one or more trading strategies on a chart, you can insert the ACC indicator using the following steps:
1. Select "New Indicator ..." from the Insert menu.
2. Select the Custom Indicator category.
3. Select the ACC indicator.
4. Select the Trading Strategy to which you wish to apply the statistic.
5. Select the Finished button.
You will notice that the ACC indicator is calculated for every bar
of the trading strategy and includes all previous positions and the current
open position in its calculation. Because of NeuroShell Trader's
unique ability to have multiple trading systems on a single chart, it is
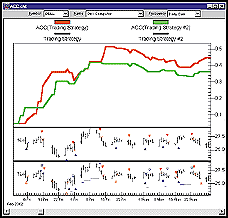
very easy to use this statistic to compare multiple trading strategies.
To do so, create an ACC indicator for each of the trading strategies that
you have on a chart and compare the resulting performance measures. A sample
chart is in Figure 11.
Figure 11: NEUROSHELL TRADER, NONPARAMETRIC PERFORMANCE MEASURE. Here's an example of comparing the performance of two different trading systems in NeuroShell Trader using the nonparametric performance measure.
Users of NeuroShell Trader can go to the STOCKS & COMMODITIES
section of the NeuroShell Trader free technical support website to download
a copy of any Traders' Tip. For more information on NeuroShell Trader,
visit www.NeuroShell.com.
--Marge Sherald, Ward Systems Group, Inc.GO BACK
301 662-7950, sales@wardsystems.com
https://www.neuroshell.com
![]() NeoTicker:
THE MOVING TREND
NeoTicker:
THE MOVING TREND
To implement in NeoTicker the concept presented in "The Moving Trend" by William Rafter, you can use NeoTicker's formula language to handle the task easily. First, create an indicator named movtrend with one integer parameter, Periods (Listing 1). Then, create another indicator named myidx to plot the surrogate data series with four plots using NeoTicker's special meta candle style to plot the result in candlesticks with one integer parameter (Listing 2).
The movtrend indicator will plot a line that shows the moving trend
of the data series (Figure 12). The myidx indicator will plot the results
of the smoothing of all four values as candlesticks (Figure 13).
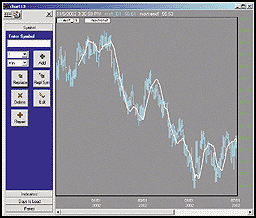
Figure 12: NEOTICKER, MOVING TREND. The movtrend indicator in NeoTicker will plot a line that shows the moving trend of the data series.
Figure 13: NEOTICKER, MOVING TREND. The myidx indicator in NeoTicker will plot the results of the smoothing of all four values as candlesticks.
A downloadable version of this indicator is available from the Yahoo! NeoTicker user group file area at https://groups.yahoo.com/group/neoticker/.LISTING 1 n := param1; mycount := mycount +1; mywsum := waverage (data1, n) * (n+1)*n / 2; mysum := summation (data1, n); myna := (6*mywsum)/(n*(n+1)); myb := 2*mysum/n; plot1 := myna - myb; success1 := if (mycount >= n, 1, 0); LISTING 2 plot1 := movtrend (data1.open, param1); plot2 := movtrend (data1.high, param1); plot3 := movtrend (data1.low, param1); plot4 := movtrend (data1.close, param1);
--Kenneth Yuen, TickQuest Inc.GO BACK
www.tickquest.com
![]() METASTOCK: THE MOVING TREND
METASTOCK: THE MOVING TREND
In "The Moving Trend" in this issue, William Rafter introduces the linear regression indicator. This indicator already exists in MetaStock and is very easy to access.
Open the desired chart to which you would like to apply the linear regression indicator. Take your cursor up to the Indicator Quicklist and click on the linear regression indicator. Drag it onto the chart and release. The linear regression indicator properties dialogue comes up, and you can choose the parameters you would like to apply to the chart.
--Scott Brown, Equis International
800 882-3040, www.equis.com
![]() SMARTrader: MOVING TREND
SMARTrader: MOVING TREND
Implementation of the technique given in "The Moving Trend" by William Rafter in this issue is simple in SmarTrader since the program includes a linear regression study, Lnreg, which replicates the calculation performed in the article.
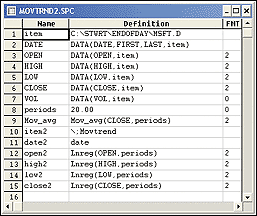
Since varying periods were discussed for the technique, we started with a coefficient, called periods, in row 8 of the SmarTrader specsheet in Figure 14, to contain the number of periods. By using the coefficient, we can modify the results of the illustrative moving average and the Lnreg calculations in one operation. Next, we added a simple moving average, Mov_avg, in row 9. Note that instead of a number of periods, the name of the coefficient is used.
Figure 14: SMARTRADER, MOVING TREND. Here's the SmarTrader specsheet for the moving trend study.
Following along with the author's discussion of a surrogate
price chart, we added user rows to simulate a true data item, calculating
the surrogate prices, open2, high2, low2 and close2 by applying the Lnreg
study to Open, High, Low and Close. The coefficient, periods, is used for
the number of periods. The surrogate price item has a "2"
appended to the field names to differentiate it from the real data item.
We added a comment to row 10 to give the surrogate item a name.
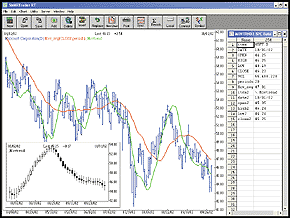
We first plotted the bar chart of the real MSFT data. To it we added the simple moving average and the movtrend (Figure 15). Note that movtrend is actually close2, row 15, in the surrogate item.
Since Rafter mentions drawing a candle chart from the surrogate data, we did just that (Figure 15). The surrogate data plots just like any regular data item.
GO BACK
Figure 15: SMARTRADER, MOVING TREND. Here's a sample SmarTrader chart of the moving trend. The inset is a candlestick chart of the surrogate data.
--Jim Ritter, Stratagem Software
504 885-7353, Stratagem1@aol.com
![]() WALL STREET ANALYZER: THE MOVING TREND
WALL STREET ANALYZER: THE MOVING TREND
This month, William Rafter discusses "The Moving Trend." The linear regression indicator is built into Wall Street Analyzer. To use it in a chart, go in the Preferences, select Indicators tab. There, you'll see "1st Mov. Average" and "2nd Mov. Average." To the right of these options you'll find two combo lists. Click on them and you can select the option "linear regression" and set the period of this indicator.
To display them on a chart, select the options. A sample chart is shown
in Figure 16.
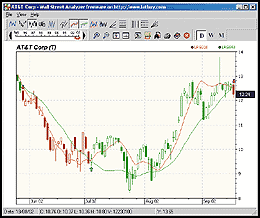
Figure 16: WALL STREET ANALYZER, MOVING TREND. Here's the moving trend (20 and 50 days) and the system displayed on the same chart.If you want to use the moving trend in the Indicators Builder or to write systems based on this indicator, here is an example using the function LinReg (linear regression or moving trend):
'Moving Trend
' Indicator display the 10-period Moving Trend of closing prices
Sub Main
  SetIndic(LinReg(GetClose, 10))
End Sub
Note: you can replace GetClose by GetOpen, GetLow, GetHigh if you
want, or create four indicators and display them on the same panel.
' System based on two Moving Trend and cross over
' Mov Trend Crossover
Sub Main()
  SMA10 = LinReg(GetClose, 20)
  SMA20 = LinReg(GetClose, 50)
  For CurrentBar = BeginBar + 1 to EndBar
    If Cross(SMA10, SMA20, CurrentBar) then
      Buy(CurrentBar)
    ElseIf Cross(SMA20, SMA10, CurrentBar) then
      Sell(CurrentBar)
    End If
  Next
End Sub
A sample Wall Street Analyzer report is in Figure 17.
It shows the results of a moving trend crossover system versus a simple
moving average crossover system.
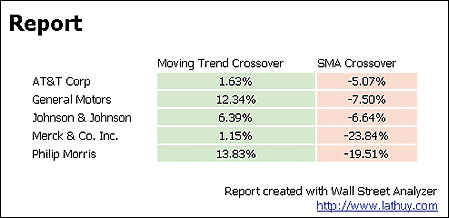
Figure 17: WALL STREET ANALYZER, MOVING TREND. Here's the moving trend crossover system compared to a simple moving average crossover system (same periods, 20 and 50 days) tested on 200 last quotes.
--Frederic D. Collin, Wall Street Analyzer
Lathuy.com
![]() AIQ: THE MOVING TREND
AIQ: THE MOVING TREND
Here is the code for use in AIQ's Expert Design Studio based
on William Rafter's article in this issue, "The Moving Trend,"
with a moving trend in green (Figure 18).
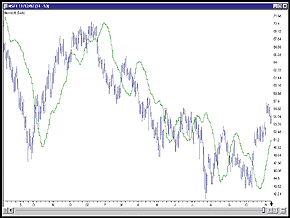
Figure 18: AIQ, MOVING TREND. The moving trend is in green.
!!!!  Stocks and Commodities, January 2003.  "The Moving Trend" by William Rafter.
define days 20.
data is [close].
fact is (days + 1)/3.
DaysInto is OffsetToDate(month(),day(),year()).
numx is iff( daysInto = 0, 1, DaysInto + 1).
factx is (numx - fact) * data.
Sx is Sum( factx, days).
MoveTrend is (6/(days * (days +1))) * Sx .
--Mike Kaden, Aiq SystemsGO BACK
www.aiq.com
![]() TECHNIFILTER PLUS: THE MOVING TREND
TECHNIFILTER PLUS: THE MOVING TREND
TechniFilter Plus' R-Modifier returns the end point of the least-squares fit line. Thus, the formula, CR5, plots for each the endpoint of the five-day least-squares fit line ending on that day. This is exactly the definition of William Rafter's moving trend indicator.
Visit Rtr's website to download this formula as well as program
updates. A sample chart is in Figure 19.
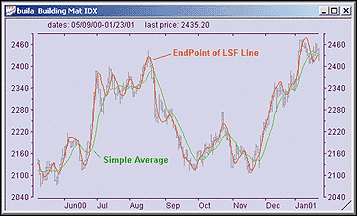
Figure 19: TECHNIFILTER PLUS, MOVING TREND. Here's a TechniFilter Plus chart showing the moving trend in red.--Clay Burch, RTR Software
919 510-0608, rtrsoft@aol.com
www.rtrsoftware.com
![]() WAVE WI$E Market Spreadsheet: THE MOVING TREND
WAVE WI$E Market Spreadsheet: THE MOVING TREND
The following Wave Wi$e formulas calculate the simple moving average, the moving trend (linear regression) and the weighted moving average.
A: DATE @TC2000(C:\TC2000V3\Data,DJ-30,Dow Jones Industrials,DB)
B: HIGH
C: LOW
D: CLOSE
E: OPEN
F: VOL
G:
H: Avg       @MAVG(CLOSE,20)  ' average
I: Regress   @LREG(CLOSE, 20)   ' trend
J: Weighted  @WAVG(CLOSE, 20)  ' weighted average
K:            ' ==========End Spreadsheet Formulas
--Peter Di Girolamo, Jerome Technology
908 369-7503, jtiware@aol.com
https://members.aol.com/jtiware
All rights reserved. © Copyright 2002, Technical Analysis, Inc.
Return to January 2003 Contents


