INDICATORS
Aim To Trade
Zigzag Targets
by William Cringan
Isolate large or small price moves to suit your type of trading.
The zigzag indicator presents major price moves by connecting peaks and troughs with straight lines. By controlling the minimum that prices must reverse before a new trend, or "zig," is established, you can isolate price moves, whether large or small, to suit your trading. Further, the zigzag indicator is adaptable for the type of trading you're into, whether daytrading or position trading; daytraders are interested in quick, short moves, whereas position traders are interested in larger moves over periods of weeks or months.
DEVIATION OSCILLATOR
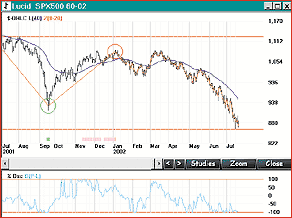
In his article "Zigzag Validity" in the August 2002 STOCKS & COMMODITIES, Spyros Raftopoulos focused on the most pressing questions facing traders: "Where are we now?" and "What price action is likely to come next?" This article will present a 40-year review of the Standard & Poor's 500, demonstrating how the zigzag indicator can shed light on those questions. Figure 1 shows the S&P 500 index over a year to July 18, 2002. Note how the zigzag indicator peaks at 1054 in the first week of January 2002. The zigzag for the final leg is not calculated, since an 8% reversal has not occurred. In addition, see how the normalized deviation measure has bottomed at -100% and appears to be down for the count.

Figure 1: THE DEVIATION OSCILLATOR. Price action in the S&P 500 over the past year shows the deviation oscillator moving from minimum to maximum along with the zigzag line. The current decline in the index is mirrored by the oscillator hitting maximum lows in May and again recently in June to July 2002.
...Continued in the February 2003 issue of Technical Analysis of STOCKS & COMMODITIES
Excerpted from an article originally published in the February 2003 issue of Technical Analysis of STOCKS & COMMODITIES magazine. All rights reserved. © Copyright 2003, Technical Analysis, Inc.