ANATOMY OF A TRADE
Best Of Both Worlds
Fundamentally Technical
by Phil Doyle
Here's how you can use both techniques to increase your returns.
The average buyside analyst spends endless hours poring over balance sheets and income statements in much the same way that traders and technical analysts spend untold hours reviewing charts. Many technicians are quick to dismiss fundamental data as already taken into account in price, while some fundamental analysts will scoff at the work of technicians as voodoo. I would be the last to suggest we set aside our beloved charts in favor of spreadsheets, but results could be improved by incorporating a basic level of fundamental analysis into charting and trading.
WHY COMBINE THE TWO?
Some compelling arguments can be made for this approach:
1. I would take issue with the belief that the market is efficient, and all available information has been incorporated into the price at any given moment. Perception is everything. Misperceptions make for inefficiencies, and inefficiencies make for good trades.
2. Even if you accept the premise that all data has already been
factored in the price, you still need to deal with how it got there. The
market does not instantly adjust to improving or deteriorating fundamentals.
That takes time, and meanwhile you are better off trading with the movement
than against it.
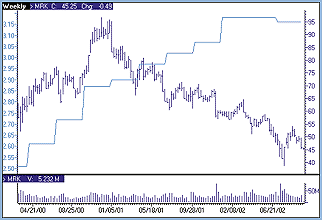
Figure 1: A PICTURE IS WORTH 1,000 DATA POINTS. Here you see a two-year, weekly chart of Merck (MRK) with quarterly earnings.
...Continued in the February 2003 issue of Technical Analysis of STOCKS & COMMODITIES
Excerpted from an article originally published in the February 2003 issue of Technical Analysis of STOCKS & COMMODITIES magazine. All rights reserved. © Copyright 2003, Technical Analysis, Inc.