QUANTITATIVE ANALYSIS
Save Yourself Some Time And Effort
The Concept Of Equivalence
by Giorgos Siligardos, Ph.D.
Try this to avoid using two indicators that are equivalent.
Let me present an objective, mathematical way to determine when two indicators are equivalent with respect to divergence. Knowing when two or more indicators are equivalent will allow you to watch only one of them for divergences, saving you time. Further, by using appropriate functions, you can convert a normalized (bounded) oscillator into a denormalized one and preserve its performance with respect to divergence. This lets you create indicators as compositions of normalized and nonnormalized oscillators.
For example, the addition of a normalized oscillator to a nonnormalized one would probably be of little value, since in extreme market moves the nonnormalized oscillator would take enormous values compared to those of the normalized one. If you can denormalize the normalized oscillator and preserve its diverging performance, you could add it to the nonnormalized one.
INDICTATOR DIVERGENCE
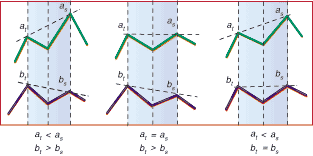
Figure 1 illustrates the divergence of two indicators a and b at a market top. Indicator a creates two tops at and as at times t and s, and indicator b creates two corresponding tops bt and bs. There are three scenarios: indicator a moves higher while indicator b moves lower, indicator a remains flat while indicator b moves lower, or indicator a moves higher while indicator b remains flat.

Figure 1: TOP DIVERGENCES. Here are three different types of divergences you can expect to see at market tops.
...Continued in the February 2003 issue of Technical Analysis of STOCKS & COMMODITIES
Excerpted from an article originally published in the February 2003 issue of Technical Analysis of STOCKS & COMMODITIES magazine. All rights reserved. © Copyright 2003, Technical Analysis, Inc.
Return to February 2003 Contents