FUTURES LIQUIDITY
Trading liquidity is often overlooked as a key technical measurement in
the analysis and selection of commodity futures. The following explains
how to read the futures liquidity chart published by Technical Analysis
of STOCKS & COMMODITIES every month.
COMMODITY FUTURES
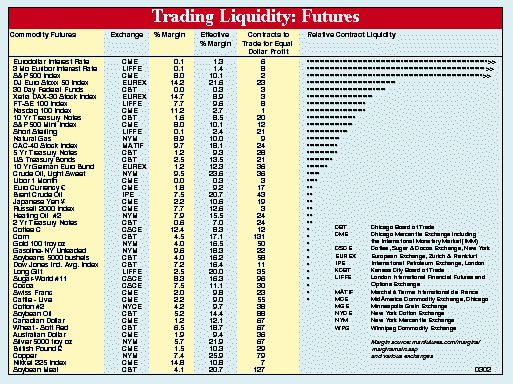
The futures liquidity chart shown below is intended to rank publicly traded
futures contracts in order of liquidity. Relative contract liquidity is
indicated by the number of dots on the right-hand side of the chart.
This liquidity ranking is produced by multiplying contract point value
times the maximum conceivable price motion (based on the past three years'
historical data) times the contract's open interest times a factor (usually
1 to 4) for low or very high volumes. The greatest number of dots indicates
the greatest activity; futures with one or no dots show little activity
and are therefore less desirable for speculators.
All futures listed are weighted equally under "contracts to trade for
equal dollar profit." This is done by multiplying contract value times
the maximum possible change in price observed in the last three-year period.
Thus, all numbers in this column have an equal dollar value.
Columns indicating percent margin and effective percent margin provide
a helpful comparison for traders who wish to place their margin money efficiently.
The effective percent margin is determined by dividing the margin value
($) by the three-year price range of contract dollar value, and then multiplying
by one hundred.
STOCKS
Trading liquidity has a significant effect on the change in price of a
security. Theoretically, trading activity can serve as a proxy for trading
liquidity and equals the total volume for a given period expressed as a
percentage of the total number of shares outstanding. This value can be
thought of as the turnover rate of a firm's shares outstanding.

Trading Liquidity: Futures is a reference chart for speculators.
It compares markets according to their per-contract potential for profit
and how easily contracts can be bought or sold (i.e., trading liquidity).
Each is a proportional measure and is meaningful only when compared to
others in the same column. The number in the "Contracts to Trade for Equal
Dollar Profit" column shows how many contracts of one commodity must be
traded to obtain the same potential return as another commodity. Contracts
to Trade = (Tick $ value) x (3-year Maximum Price Excursion). "Relative
Contract Liquidity" places commodities in descending order according to
how easily all of their contracts can be traded. Commodities at the top
of the list are easiest to buy and sell; commodities at the bottom of the
list are the most difficult. "Relative Contract Liquidity" is the number
of contracts to trade times total open interest times a volume factor,
which is the greater of: 1 or exp (1n (volume) / 1n (5000)) - 2.
Return to February 2003 Contents

