February 2003
TRADERS' TIPS
You can copy these formulas and programs for easy use in your spreadsheet or analysis software. Simply "select" the desired text by highlighting as you would in any word processing program, then use your standard key command for copy or choose "copy" from the browser menu. The copied text can then be "pasted" into any open spreadsheet or other software by selecting an insertion point and executing a paste command. By toggling back and forth between an application window and the open Web page, data can be transferred with ease.
This month's tips include formulas and programs for:
TRADESTATION: Z-SCORE INDICATOR
TRADESTATION: ZIGZAG TARGETS
METASTOCK: ZIGZAG TARGETS
AMIBROKER: Z-SCORE
AMIBROKER: ZIGZAG TARGETS
eSIGNAL: Z-SCORE
eSIGNAL: ZIGZAG TARGETS
WEALTH-LAB: Z-SCORE
WEALTH-LAB: ZIGZAG TARGETS
NEUROSHELL TRADER: Z-SCORE
NEOTICKER: Z-SCORE
TRADINGSOLUTIONS: Z-SCORE
INVESTOR/RT: Z-SCORE INDICATOR
INVESTOR/RT: ZIGZAG TARGETS
AIQ EXPERT DESIGN STUDIO: Z-SCORE
SMARTTRADER: Z-SCORE
WALL STREET ANALYZER: Z-SCORE
WAVE WI$E MARKET SPREADSHEET: Z-SCORE
FINANCIAL DATA CALCULATOR: Z-SCORE
or return to February 2003 Contents
![]() TRADESTATION: Z-SCORE INDICATOR
TRADESTATION: Z-SCORE INDICATOR
Veronique Valcu's article "Z-Score Indicator" in this issue provides a description and commentary on a new method of displaying directional change normalized in terms of standard deviation. This indicator can be drawn on a TradeStation screen by using the following function code, called ZScore:
Function: ZScore
inputs:
 Price( NumericSeries ),
 AvgLen( NumericSimple ) ;
ZScore = (Price - Average( Price, AvgLen ) )
 / StandardDev( Price, AvgLen, 1 ) ;
This indicator has two inputs, "Price" and "AvgLen."
Price can be the open, high, low, or close. AvgLen describes the length
of the sample considered in the standard deviation calculation.
Once created and verified, the function can be easily called in any indicator or strategy. Following is a simple strategy suggested by the article:
Strategy: ZScore Test
inputs:
 Price( Close ),
 AvgLen( 20 ),
 Smooth1( 3 ),
 Smooth2( 5 ) ;
variables:
 Curve1( 0 ),
 Curve2( 0 ) ;
Curve1 = Average( ZScore( Price, AvgLen), Smooth1 ) ;
Curve2 = Average( Curve1, Smooth2 ) ;
if Curve1 Crosses Over Curve2 then
 Buy Next Bar at Market ;
if Curve1 Crosses Under Curve2 then
 SellShort Next Bar at Market ;
In Figure 1, we have replicated Figure 3 from Valcu's article
using the built-in Custom 1 Line, Custom 2 Line, and Bollinger Bands indicators.
In addition, we have inserted the "ZScore Test" strategy
code given in the previous paragraph. The inputs for the Custom 1 Line
indicator were "ZScore(Close,20)" and "False."
The inputs for the Custom 2 Line indicator were "Average(ZScore(Close,20),3)",
"Average(Average(ZScore(Close,20),3),5)", and "False."

Figure 1: TRADESTATION, Z-SCORE INDICATOR. Here's a sample TradeStation chart demonstrating the z-score indicator. It uses the built-in Custom 1 Line, Custom 2 Line, and Bollinger Bands indicators.
This indicator and function code will be available for download
from the EasyLanguage Exchange at www.tradestationworld.com.
-- Mark Mills
EasyLanguage Specialist
TradeStation Technologies, Inc. (formerly Omega Research, Inc.)
A subsidiary of TradeStation Group, Inc.
www.TradeStation.com, www.TradeStationWorld.com
![]() TRADESTATION: ZIGZAG TARGETS
TRADESTATION: ZIGZAG TARGETS
William Cringan's article "Zigzag Targets" in this issue presents a process for producing statistical reports on the correlation between a normalized simple deviation indicator and zigzag legs over any chart period. The process seeks to quantify an answer to the question, "Where are we now?"
The process starts with the creation of zigzag legs based on a user-determined retracement value. The zigzag legs are easily drawn by an indicator that comes with TradeStation. Once the beginning and ending for each leg has been fixed, each price bar can be classified into one of six segment types: up leg (B) or down leg (S), and beginning (1), middle (2), or end (3) of the move. For each bar, we calculate the deviation from the mean and normalize it for the last 80 bars. The normalized values are then cross-tabulated against the zigzag segment to produce a correlation matrix. With this matrix, we can take today's normalized deviation value and read off the probability that we are currently in any given zigzag segment (B1, B2, B3, S1, S2, or S3).
Following is a description and listing of a TradeStation 6 indicator that will automate the entire process, drawing the zigzag legs on a chart and printing the correlation matrix in the EasyLanguage Output Bar.
Here is a quick overview of our coding effort. We start with the built-in ZigZag % indicator that comes with TradeStation 6. We are going to edit and expand this indicator's abilities. First, we insert some code to calculate our normalized deviation indicator. Second, we insert a labeling loop for noting: 1) the portion of each zigzag leg the bar occupies (S1, S2, S3, etc.); 2) which range of values the indicator happened to be in; and 3) the direction from which the indicator arrived there. The final coding task outputs our results in a reporting routine. This portion of the code calculates the final probabilities and prints them to the EasyLanguage output bar.
When complete, our indicator provides us with the basic code for calculating and drawing each zigzag leg on a chart. It is important to remember that any given zigzag is incomplete until the required retracement amount has been locked in by price action. This means we never know what leg we are currently in until enough time has passed to allow the price to significantly retrace itself.
Our plan for adapting the ZigZag % indicator involves taking advantage of the "lockdown" moments. In terms of the code, these occur when the variable AddTL is set to the value "true." The original code used the AddTL as a flag for drawing a new trendline. The beginning time and value of the new trendline is fixed, but future price action may change the new trendline's ending time and value. We will copy the old, fixed point's bar number to one value of an array and the new, fixed point's bar number to a second. We then use a "for" loop to traverse the bars between the two points, labeling each bar for their appropriate indicator and zigzag category.
For error-checking purposes, we print out the bar-by-bar labels for each time segment's place in the zigzag and its deviation group. We have used numeric labels, which will correspond with the indices of a multidimensional array. Once the labels are properly formatted, you can use the statement "Count[Index1, Index2, Index3] = Count[Index1, Index2, Index3] + 1 ;" to keep a tidy tally of how many bars fit into each categorical possibility.
During the calculations, we use IntPortion (returns integer value of a floating point number) and HighestFC (highest value in data range, "fast calculation"). The HighestFC function is faster than the "Highest" function because it maintains values in memory from one bar to the next. The "Highest" function must reload the entire data range each bar. If you are going to make a "Highest" calculation at every bar, use HighestFC and avoid the delay for loading the same data over and over again.
In summary, it shouldn't be too hard to modify the built-in ZigZag % function on your own. You might want to try your own favorite indicator while you are at it. Be sure to leave the normalizing code in place, though.
The screen snapshot in Figure 2 displays the results of our work. In the upper portion, we replicate Figure 1 of Cringan's article. In the lower section, we display a section of the correlation matrix. The zigzag lines are produced by our indicator. Subgraph 2 displays a second indicator, normalized deviation.

Figure 2: TRADESTATION, ZIGZAG CORRELATION. Here's a sample TradeStation chart displaying the ZigZag Corr Matrix indicator and correlation matrix report. In the upper portion, Figure 1 from William Cringan's article is replicated. In the lower section, a section of the correlation matrix is displayed. The zigzag lines are produced by our indicator. Subgraph 2 displays a second indicator, normalized deviation.
The ZigZag Corr Matrix indicator and correlation matrix report
Indicator: ZigZag Corr Matrix
inputs:
 Price( Close ),
 RetracePct( 5 ),
 LineColor( Yellow ),
 LineWidth( 1 ),
 TgtZonePct( .3 ),
 AvgLen( 40 ),
  LookBackForNorm( 80 ) ;
variables:
 NewSwingPrice( 0 ),
 TLDir( 0 ), { TLDir = -1 implies prev TL dn, +1
  implies prev TL up }
 RetraceFctrUp( 1 + RetracePct / 100 ),
 RetraceFctrDn( 1 - RetracePct / 100 ),
 SaveSwing( false ),
 AddTL( false ),
 UpdateTL( false ),
 TLRef( 0 ),
  TgtZone( 0 ),
    B2_level( 0 ),
 S1_level( 0 ),
  B1_level( 0 ),
 S2_level( 0 ),
 Class ( 0 ),
  MyAverage( 0 ),
 Deviation( 0 ),
  NormDev( 0 ),
 BinNormDev1( 0 ),
 BinNormDev2( 0 ),
 MaxDev( 0 ),
 MinDev( 0 ),
 Direction( 0 ) ;
  { 1 implies indicator moved up, 2 implies down }
arrays:
 SwingPrice[2]( Price ),
 SwingDate[2]( Date ),
 SwingTime[2]( Time ),
 SwingBar[2]( BarNumber ),
 FixedSwingPrice[2]( Price ),
 FixedSwingDate[2]( Date ),
 FixedSwingTime[2]( Time ),
 FixedSwingBar[2]( BarNumber ),
 Count[ 5, 10, 25 ]( 0 ) ;
{ Deviation Calculations }
MyAverage = AverageFC( Close, AvgLen ) ;
Deviation = Close - MyAverage ;
MaxDev = HighestFC( Deviation, LookBackForNorm ) ;
MinDev = LowestFC( Deviation, LookBackForNorm ) ;
NormDev = ( ( Deviation - MinDev )
 / ( MaxDev - MinDev ) * 200 ) - 100  ;
 { Candidate swings are just-confirmed,
 3-bar (Str=1), SwingHi's and SwingLo's }
NewSwingPrice = SwingHigh( 1, Price, 1, 2 ) ;
if NewSwingPrice  <> -1 then
 begin
 if TLDir <= 0
  and NewSwingPrice >= SwingPrice[0]
   * RetraceFctrUp
 then { prepare to add new up TL }
  begin
  SaveSwing = true ;
  AddTL = true ;
  TLDir = 1 ;
  end
 else if TLDir = 1
  and NewSwingPrice >= SwingPrice[0]
 then { prepare to update prev up TL }
  begin
  SaveSwing = true ;
  UpdateTL = true ;
  end ;
 end
else
 begin
 NewSwingPrice = SwingLow( 1, Price, 1, 2 ) ;
 if NewSwingPrice <> -1 then
  begin
  if TLDir >= 0
   and NewSwingPrice <= SwingPrice[0]
    * RetraceFctrDn
  then { prepare to add new dn TL }
   begin
   SaveSwing = true ;
   AddTL = true ;
   TLDir = -1 ;
   end
  else if TLDir = -1
   and NewSwingPrice <= SwingPrice[0]
  then  { prepare to update prev dn TL }
   begin
   SaveSwing = true ;
   UpdateTL = true ;
   end ;
  end ;
 end ;
if SaveSwing then
 { save new swing and reset SaveSwing }
 begin
 for Value1 = 2 downto 1
  begin
  SwingPrice[Value1] = SwingPrice[ Value1 - 1 ] ;
  SwingDate[Value1] = SwingDate[ Value1 - 1 ] ;
  SwingTime[Value1] = SwingTime[ Value1 - 1 ] ;
  SwingBar[Value1] = SwingBar[ Value1 - 1 ] ;
  end ;
 SwingPrice[0] = NewSwingPrice ;
 SwingDate[0] = Date[1] ;
 SwingTime[0] = Time[1] ;
 SwingBar[0] = BarNumber[1] ;
 SaveSwing = false ;
 end ;
if AddTL then
 begin
 for Value1 = 2 downto 1
  begin
  FixedSwingPrice[Value1] =
   FixedSwingPrice[ Value1 - 1 ] ;
  FixedSwingDate[Value1] =
   FixedSwingDate[ Value1 - 1 ] ;
  FixedSwingTime[Value1] =
   FixedSwingTime[ Value1 - 1 ] ;
  FixedSwingBar[Value1] =
   FixedSwingBar[ Value1 - 1 ] ;
  end ;
 FixedSwingPrice[0] = SwingPrice[1] ;
 FixedSwingDate[0] = SwingDate[1] ;
 FixedSwingTime[0] = SwingTime[1] ;
 FixedSwingBar[0] = SwingBar[1] ;
 { add new TL and reset AddTL }
 TLRef = TL_New( SwingDate[1], SwingTime[1],
  SwingPrice[1], SwingDate[0],
 SwingTime[0], SwingPrice[0] ) ;
 TL_SetExtLeft( TLRef, false ) ;
 TL_SetExtRight( TLRef, false ) ;
 TL_SetSize( TLRef, LineWidth ) ;
 TL_SetColor( TLRef, LineColor ) ;
 AddTL = false ;
 TgtZone =  TgtZonePct
  * ( FixedSwingPrice[0] - FixedSwingPrice[1] ) ;
 if TLDir[1] = 1 then
  begin
  B1_level = FixedSwingPrice[1] + TgtZone ;
  B2_level = FixedSwingPrice[0] - TgtZone ;
  end
 else if TLDir[1] =-1 then
  begin
  S1_level = FixedSwingPrice[1] + TgtZone ;
  S2_level = FixedSwingPrice[0] - TgtZone ;
  end ;
 for Value1 = CurrentBar - FixedSwingBar[1] - 1
  downto CurrentBar - FixedSwingBar[0]
  begin { -1 for duplicate entry for TL start/end }
  if  TLDir[1] = 1 then
    begin
   if ( Class = 2 or Class = 1 )
     and Close[Value1] crosses over B2_Level
   then
    Class = 3
   else if Class = 1
    and Close[Value1] crosses over B1_Level
   then
    Class = 2
   else if Class <> 2 and Class <> 3 then
    Class = 1 ;
   end
  else
   begin
   if ( Class = 5 or Class = 4 )
     and Close[Value1] crosses under S2_Level
   then
    Class = 6
   else if Class = 4
    and Close[Value1] crosses under S1_Level
   then
    Class = 5
   else if Class <> 2 and Class <> 6 then
    Class = 4 ;
   end ;
  BinNormDev1 =
   IntPortion( NormDev[Value1] / 20 ) ;
  BinNormDev2 =
   IntPortion( NormDev[ Value1 + 1 ] / 20 ) ;
  if BinNormDev2 > BinNormDev1 then
   Direction = 2
  else if BinNormDev2 < BinNormDev1 then
   Direction = 1 ;
  BinNormDev1 =
   IntPortion( NormDev[Value1] / 10 ) ;
  Print( Date[Value1], " ", Class, " ",
   BinNormDev1 * 10, " ", Direction ) ;
  Count[ Direction, Class, BinNormDev1 + 10 ] =
   Count[ Direction, Class, BinNormDev1 + 10 ]
   + 1 ;
  end ;
 end
else if UpdateTL then
 { update prev TL and reset UpdateTL }
 begin
 TL_SetEnd( TLRef, SwingDate[0],
  SwingTime[0], SwingPrice[0] ) ;
 UpdateTL = false ;
 end ;
if LastBarOnChart then
 begin
 Print( "SPX500 3/11/99 to 12/12/02 " ) ;
 Print( "Deviation of Price and Long Average ",
  "Target Zone Correlation Matrix" ) ;
 Print( " " ) ;
 for Value1 = 1 to 2
  begin
  Print( " " ) ;
  if Value1 = 1 then
   Print( "Upward indicator motion " )
  else
   Print( "Downward indicator motion " ) ;
  Print( "Class                B1           B2",
   "         B3          S1          S2",
         "      S3" ) ;
  for Value2 = 1 to 20
   begin
   Value3 = 0 ;
   for Value4 = 1 to 6
    begin
    Value3 = Count[ Value1, Value4,
     Value2 ] + Value3 ;
    end ;
   if Value3 > 0 then
    Print( "<",(Value2*10-100):3:0,
     " to ",
     iff( Value2 * 10 - 91 < 100,
     Value2 * 10 - 91, 100 ):3:0,"> ",
     Count[ Value1, 1, Value2 ]
     / Value3 * 100,"% ",
     Count[ Value1, 2, Value2 ]
     / Value3 * 100,"% ",
     Count[ Value1, 3, Value2 ]
     / Value3 * 100,"% ",
    Count[ Value1, 4, Value2 ]
     / Value3 * 100,"% ",
    Count[ Value1, 5, Value2 ]
    / Value3 * 100,"% ",
    Count[ Value1, 6, Value2 ]
    / Value3 * 100,"%" )
   else
    Print( "<",(Value2*10-100):3:0, " to ",
     iff( Value2 * 10 - 91 < 100,
     Value2 * 10 - 91 , 100 ):3:0,
     "> ", 0:11:0, " ", 0:11:0, " ",
     0:11:0, " ", 0:11:0, " ", 0:11:0, " ",
     0:11:0 ) ;
   end ;
  end ;
 end ;
The complete code for the ZigZag Corr Matrix and Normalized Deviation
indicators is available in the EasyLanguage Exchange code library at TradeStationWorld.com.
-- Mark Mills
EasyLanguage Specialist
TradeStation Technologies, Inc. (formerly Omega Research, Inc.)
A subsidiary of TradeStation Group, Inc.
www.TradeStation.com, www.TradeStationWorld.com
![]() METASTOCK: ZIGZAG TARGETS
METASTOCK: ZIGZAG TARGETS
Here is the formula for the deviation oscillator from William Cringan's "Zigzag Targets" in this issue.
To input a new formula into MetaStock, select Indicator Builder from
the Tools menu, select New, and enter the following formula:
x:=Input("number of time periods in average",10,200,40);
x2:=x*2;
pd:=C-Mov(C,x,E);
hpd:=HHV(pd,x2);
lpd:=LLV(pd,x2);
nf:=200/(hpd-lpd);
((pd-lpd)*nf)-100
--Scott BrownGO BACK
Equis International
www.equis.com
![]() AMIBROKER: Z-SCORE
AMIBROKER: Z-SCORE
Implementation of the z-score indicator as described by Veronique Valcu in her Working Money article this issue is straightforward and simple in AmiBroker.
Listing 1 shows code for the Indicator Builder that plots the z-score. To use the z-score indicator, just copy the code to the Indicator Builder formula window and click "Apply."
A downloadable version of this formula is available from AmiBroker's website.LISTING 1 periods = 20; ZScore = ( Close - MA( Close, periods ) ) / StDev( Close, periods ); Plot( ZScore, "Z-Score", colorRed );
Figure 3 shows the z-score plotted on Microsoft with Bollinger Bands.

Figure 3: AMIBROKER, Z-SCORE. This AmiBroker chart shows a price plot of MSFT with Bollinger Bands in the upper pane and the z-score of MSFT plotted in the lower pane.
--Tomasz Janeczko, AmiBroker.com
www.amibroker.com
![]() AMIBROKER: ZIGZAG TARGETS
AMIBROKER: ZIGZAG TARGETS
In "Zigzag Targets" in this issue, author William Cringan suggests using a simple deviation measure to detect congestion zones or exhausted price moves based on significant correlation with the zigzag study. The calculations presented in the article could be relatively simply reproduced in AmiBroker using its native AFL language.
Listing 1 shows the code that plots the normalized deviation oscillator described in the article.
LISTING 1
// Calculate normalized deviation oscillator
DevOsc = Close - EMA( Close, 40 );
HdevOsc = HHV( DevOsc, 80 );
LdevOsc = LLV( DevOsc, 80 );
NormOsc = 100 * DevOsc / IIf( DevOsc > 0, HdevOsc, abs(LdevOsc) );
Plot( NormOsc, "Normalized deviation oscillator", colorRed );
Listing 2 shows a complete formula that calculates zigzag targets,
plots a price chart, plots a zones ribbon, and calculates statistics described
in Cringan's article. The code can be applied in both Indicator
Builder (to plot charts) and Automatic Analysis windows.
The exploration code calculates statistics for a single group (B1, B2,
LG, S1, S2, SH) at a time (defined in the code). The results can be copied
to Excel for further analysis if needed. To use the code in the Automatic
Analysis window, simply copy the code to the formula window and click "Explore."
LISTING 2
//////////////////////
// Traders' Tips 2/2003
// Zigzag Targets
// AFL implementation by amibroker.com
//////////////////////
// calculate Zig-Zag
Change = 8;
ZoneWidth = 0.20; // zone width, 0.2 = 20%
zz = Zig( Close, Change );
// find last and previous Peak/Trough values
// and bars where they occur
pk = Peak( Close, Change );
tr = Trough( Close, Change );
pkbars = PeakBars( Close, Change );
trbars = TroughBars( Close, Change );
// upswing is when last extremum was trough
upswing = trbars < pkbars;
fpk = ValueWhen( pkbars == 0, pk, 0 );
ftr = ValueWhen( trbars == 0, tr, 0 );
// Calculate price zones in upswing
PriceZone = ZoneWidth * ( fpk - tr );
B2 = upswing AND tr <= zz AND zz <= tr + PriceZone;
LG = upswing AND tr + PriceZone <= zz AND zz <= fpk - PriceZone;
S1 = upswing AND fpk - PriceZone <= zz AND zz <= fpk;
// Calculate price zones in downswing
PriceZone = ZoneWidth * ( pk - ftr );
S2 = NOT upswing AND pk >= zz AND zz >= pk - PriceZone;
SH = NOT upswing AND pk - PriceZone >= zz AND zz >= ftr + PriceZone;
B1 = NOT upswing AND zz <= ftr + PriceZone AND zz >= ftr;
/////////////////////
// Display part
// we plot bar chart, zig line and ribbon showing target zones
////////////////////
GraphXSpace = 3;
Plot( Close, "Close", colorBlack, styleBar );
Plot( zz, "ZigZag", colorRed, styleThick );
// Plot ribbon
Plot( 3, /* defines the height of the ribbon in percent of pane width */
"Ribbon",
IIf( B2, colorDarkGreen,
IIf( LG, colorLightGrey,
IIf( S1, colorLightOrange ,
IIf( S2, colorRed,
IIf( SH, colorLightGrey,
IIf( B1, colorPaleGreen, colorBlue ) ) ) ) ) ), /* choose color */
styleOwnScale|styleArea|styleNoLabel, -0.5, 100 );
////////////////////
// Now part that calculates statistics
////////////////////
// Calculate normalized deviation oscillator
DevOsc = Close - EMA( Close, 40 );
HdevOsc = HHV( DevOsc, 80 );
LdevOsc = LLV( DevOsc, 80 );
NormOsc = 100 * DevOsc / IIf( DevOsc > 0, HdevOsc, abs(LdevOsc) );
NormOsc = Prec( NormOsc, 2 ); // round to 2 decimal places
UP100 = Cross( NormOsc, 99.99 );
UP80_99 = Cross( NormOsc, 80 ) AND NormOsc >= 80 AND NormOsc <= 99.99;
DN80_99 = Cross( 99.99, NormOsc ) AND NormOsc >= 80 AND NormOsc <= 99.99;
UP60_79 = Cross( NormOsc, 60 ) AND NormOsc >= 60 AND NormOsc <= 79.99;
DN60_79 = Cross( 79.99, NormOsc ) AND NormOsc >= 60 AND NormOsc <= 79.99;
UP40_59 = Cross( NormOsc, 40 ) AND NormOsc >= 40 AND NormOsc <= 59.99;
DN40_59 = Cross( 59.99, NormOsc ) AND NormOsc >= 40 AND NormOsc <= 59.99;
UP20_39 = Cross( NormOsc, 20 ) AND NormOsc >= 20 AND NormOsc <= 39.99;
DN20_39 = Cross( 39.99, NormOsc ) AND NormOsc >= 20 AND NormOsc <= 39.99;
UP00_19 = Cross( NormOsc, 0 ) AND NormOsc >= 0 AND NormOsc <= 19.99;
DN00_19 = Cross( 19.99, NormOsc ) AND NormOsc >= 0 AND NormOsc <= 19.99;
UPM19_00 = Cross( NormOsc, -19.99 ) AND NormOsc >= -19.99 AND NormOsc <= 0;
DNM19_00 = Cross( 0, NormOsc ) AND NormOsc >= -19.99 AND NormOsc <= 0;
UPM39_20 = Cross( NormOsc, -39.99 ) AND NormOsc >= -39.99 AND NormOsc <= -20;
DNM39_20 = Cross( -20, NormOsc ) AND NormOsc >= -39.99 AND NormOsc <= -20;
UPM59_40 = Cross( NormOsc, -59.99 ) AND NormOsc >= -59.99 AND NormOsc <= -40;
DNM59_40 = Cross( -40, NormOsc ) AND NormOsc >= -59.99 AND NormOsc <= -40;
UPM79_60 = Cross( NormOsc, -79.99 ) AND NormOsc >= -79.99 AND NormOsc <= -60;
DNM79_60 = Cross( -60, NormOsc ) AND NormOsc >= -79.99 AND NormOsc <= -60;
UPM99_80 = Cross( NormOsc, -99.99 ) AND NormOsc >= -99.99 AND NormOsc <= -80;
DNM99_80 = Cross( -80, NormOsc ) AND NormOsc >= -99.99 AND NormOsc <= -80;
DNM100 = Cross( -99.99, NormOsc );
Filter = Status("lastbarinrange"); // display values for last bar only
// Change the line below to:
// Cond = B1; CondName = "B1"; // to get B1 zone stats
// Cond = B2; CondName = "B2"; // to get B2 zone stats
// Cond = LG; CondName = "LG"; // to get Long zone stats
// Cond = S1; CondName = "S1"; // to get S1 zone stats
// Cond = S2; CondName = "S2"; // to get S2 zone stats
// Cond = SH; CondName = "SH"; // to get Short zone stats
Cond = B1; CondName = "B1";
AddColumn( Cum( Cond AND UP100 ), CondName + " up(100)", 1.0 );
AddColumn( Cum( Cond AND UP80_99 ), CondName + " up(80-99)", 1.0 );
AddColumn( Cum( Cond AND UP60_79 ), CondName + " up(60-79)", 1.0 );
AddColumn( Cum( Cond AND UP40_59 ), CondName + " up(40-59)", 1.0 );
AddColumn( Cum( Cond AND UP20_39 ), CondName + " up(20-39)", 1.0 );
AddColumn( Cum( Cond AND UP00_19), CondName + " up(0-19)", 1.0 );
AddColumn( Cum( Cond AND UPM19_00), CondName + " up(-19-0)", 1.0 );
AddColumn( Cum( Cond AND UPM39_20), CondName + " up(-39--20)", 1.0 );
AddColumn( Cum( Cond AND UPM59_40 ), CondName + " up(-59--40)", 1.0 );
AddColumn( Cum( Cond AND UPM79_60 ), CondName + " up(-79--60)", 1.0 );
AddColumn( Cum( Cond AND UPM99_80 ), CondName + " up(-99--80)", 1.0 );
AddColumn( Cum( Cond AND DN80_99 ), CondName + " dn(80-99)", 1.0 );
AddColumn( Cum( Cond AND DN60_79 ), CondName + " dn(60-79)", 1.0 );
AddColumn( Cum( Cond AND DN40_59 ), CondName + " dn(40-59)", 1.0 );
AddColumn( Cum( Cond AND DN20_39 ), CondName + " dn(20-39)", 1.0 );
AddColumn( Cum( Cond AND DN00_19 ), CondName + " dn(0-19)", 1.0 );
AddColumn( Cum( Cond AND DNM19_00), CondName + " dn(-19-0)", 1.0 );
AddColumn( Cum( Cond AND DNM39_20 ), CondName + " dn(-39--20)", 1.0 );
AddColumn( Cum( Cond AND DNM59_40 ), CondName + " dn(-59--40)", 1.0 );
AddColumn( Cum( Cond AND DNM79_60 ), CondName + " dn(-79--60)", 1.0 );
AddColumn( Cum( Cond AND DNM99_80 ), CondName + " dn(-99--80)", 1.0 );
AddColumn( Cum( Cond AND DNM100 ), CondName + " dn(-100)", 1.0 );
ALLUPS = ( UP100 OR UP80_99 OR UP60_79 OR UP40_59 OR UP20_39 OR UP00_19
OR UPM19_00 OR UPM39_20 OR UPM59_40 OR UPM79_60 OR UPM99_80 );
ALLDOWNS = ( DN80_99 OR DN60_79 OR DN40_59 OR DN20_39 OR DN00_19 OR DNM19_00
OR DNM39_20 OR DNM59_40 OR DNM79_60 OR DNM99_80 OR DNM100 );
AddColumn( Cum( Cond AND ALLUPS ), "Zone Total Up" );
AddColumn( Cum( Cond AND ALLDOWNS ), "Zone Total Down" );
AddColumn( Cum( ALLUPS ), "Grand Total Up" );
AddColumn( Cum( ALLDOWNS ), "Grand Total Down" );
The AmiBroker screenshot in Figure 4 shows the price plot
with overlaid zigzag lines and the colorful ribbon showing zigzag target
zones. Light green represents the B1 zone, dark green shows the B2 zone,
orange marks the S1 zone, and red shows the S2 zone. Remaining zones are
gray. In the lower pane, the normalized deviation oscillator is plotted.

Figure 4: AMIBROKER, ZIGZAG TARGETS. This AmiBroker chart demonstrates a price chart overlaid with zigzag lines and a colorful zones ribbon showing zigzag target zones. Light green represents the B1 zone, dark green shows the B2 zone, orange marks the S1 zone, and red shows the S2 zone. Remaining zones are gray. In the lower pane, the normalized deviation oscillator is plotted.
Downloadable versions of both formulas are available from the AmiBroker
website.
--Tomasz Janeczko, AmiBroker.comGO BACK
www.amibroker.com
![]() eSIGNAL: Z-SCORE
eSIGNAL: Z-SCORE
This eSignal formula is based on "Z-Score Indicator" by
Veronique Valcu in this issue.
/********************************************************************
Description: Z-Score Indicator by Veronique Valcu
Provided by: TS Support, LLC for eSignal. (c) Copyright 2002
********************************************************************/
var ma = null;
function preMain()
{
    setStudyTitle("Z-Score");
    setCursorLabelName("Z-Score", 0);
    setDefaultBarFgColor(Color.red, 0);
    addBand(0, PS_SOLID, 1, Color.lightgrey);
}
function main(Period) {
 var StdDev = 0;
 var SumSqr = 0;
 var counter = 0;
  if(Period == null)
  Period = 20;
  if(ma == null)
  ma = new MAStudy(Period, 0, "Close", MAStudy.SIMPLE);
  for(counter = - Period + 1; counter <= 0; counter++)
  SumSqr += Math.pow((close(counter) - ma.getValue(MAStudy.MA)),2);
  StdDev = Math.sqrt(SumSqr / Period);
  return (close() -  ma.getValue(MAStudy.MA)) / StdDev;
}
--eSignal, a division of Interactive Data Corp.
800 815-8256, www.esignal.com
![]() eSIGNAL: ZIGZAG TARGETS
eSIGNAL: ZIGZAG TARGETS
This eSignal formula is based on "Zigzag Targets" by William
Cringan in this issue.
/***************************************************************
Description : This Indicator plots ZigZag indicator
Provided By : Developed by TS Support, LLC for eSignal. (c) Copyright 2002
********************************************************************/
function preMain()
{
    setPriceStudy(true);
    setStudyTitle("ZigZag");
}
var First = true;
var RP = null;
var RPPoint = null;
var RP1 = null;
var RPPoint1 = null;
var Switch = 0;
var Condition1 = false;
var Condition2 = false;
var s = "X";
function main(WavePcnt, SwingHigh, SwingLow, Thickness, nColor)
{
    if (WavePcnt == null) WavePcnt = 5;
    if (SwingHigh == null) SwingHigh = "High";
    if (SwingLow == null) SwingLow = "Low";
    if (Thickness == null) Thickness = 1;
    if (nColor == null) nColor = Color.red;
    if (nColor == "red") nColor = Color.red;
    if (nColor == "black") nColor = Color.black;
    if (nColor == "blue") nColor = Color.blue;
    if (nColor == "cyan") nColor = Color.cyan;
    if (nColor == "green") nColor = Color.green;
    if (nColor == "magenta") nColor = Color.magenta;
    if (nColor == "white") nColor = Color.white;
    if (nColor == "yellow") nColor = Color.yellow;
    if (nColor == "purple") nColor = Color.purple;
    if (First)
    {
        First = false;
        RP = (high(0) + low(0)) / 2;
        RPPoint = getCurrentBarIndex();
        RP1 = RP;
        RPPoint1 = RPPoint;
    }
    var SH = 0.0;
    var SL = 0.0;
    //SwingHigh
    var Occur = 1;
    var Strength = 1;
    var Length = 2;
    var Price = SwingHigh;
    var vPrice = getValue(Price, 0, -(Strength + Length + Occur + 1));
    var Price1 = 0.0;
    var J = Strength;
    var Found = false;
    var Counter = 0;
    var X = 0;
    var XX = 0;
    var YY = 0;
    var Truth = true;
    for (J = Strength; (J < Length)&&(Found == false); J++)
    {
        Price1 = vPrice[J];
        X = J + 1;
  Truth = true;
  for (X = (J + 1); ((X - J) <= Strength)&&(Truth); X++)
  {
            if (Price1 < vPrice[X]) Truth = false;
  }
  X = J - 1;
  for (X = (J - 1); ((J - X) <= Strength)&&(Truth); X--)
  {
            if (Price1 <= vPrice[X]) Truth = false;
  }
  if (Truth) Counter++;
  if (Counter >= Occur) Found = true;
    }
    if (Found) SH = Price1;
 else SH = -1;
 //SwingLow
 Price = SwingLow;
    vPrice = getValue(Price, 0, -(Strength + Length + Occur + 1));
    J = Strength;
    Found = false;
    Counter = 0;
    for (J = Strength; (J < Length)&&(Found == false);J++)
    {
        Price1 = vPrice[J];
  X = J + 1;
  Truth = true;
  for (X = (J + 1); ((X - J) <= Strength)&&(Truth); X++)
  {
            if (Price1 > vPrice[X]) Truth = false;
  }
  X = J - 1;
  for (X = (J - 1); ((J - X) <= Strength)&&(Truth); X--)
  {
            if (Price1 >= vPrice[X]) Truth = false;
  }
  if (Truth) Counter++;
  if (Counter >= Occur) Found = true;
    }
    if (Found) SL = Price1;
    else SL = -1;
    //ZigZag
    if (SH != -1)
    {
        if ((Switch != 1)&&(SH >= (RP * (1+(WavePcnt*.01)))))
        {
            s += "X";
            RPPoint1 = RPPoint;
            RP1 = RP;
            RPPoint = getCurrentBarIndex() - 1;
            RP = SH;
            drawLineAbsolute(RPPoint,RP,RPPoint1,RP1, PS_SOLID, Thickness,
nColor, s);
            Switch = 1;
        }
        else
        if ((Switch == 1)&&(SH >= RP))
        {
            RPPoint = getCurrentBarIndex() - 1;
            RP = SH;
            drawLineAbsolute(RPPoint,RP,RPPoint1,RP1, PS_SOLID, Thickness,
nColor, s);
        }
    }
    if (SL != -1)
    {
        if ((Switch != -1)&&(SL <= (RP - (RP*(WavePcnt*.01)))))
        {
            s += "X";
            RPPoint1 = RPPoint;
            RP1 = RP;
            RPPoint = getCurrentBarIndex() - 1;
            RP = SL;
            drawLineAbsolute(RPPoint,RP,RPPoint1,RP1, PS_SOLID, Thickness,
nColor, s);
            Switch = -1;
        }
        else
        if ((Switch == -1)&&(SL <= RP))
        {
            RPPoint = getCurrentBarIndex() - 1;
            RP = SL;
            drawLineAbsolute(RPPoint,RP,RPPoint1,RP1, PS_SOLID, Thickness,
nColor, s);
        }
    }
    return;
}
--eSignal, a division of Interactive Data Corp.
800 815-8256, www.esignal.com
![]() WEALTH-LAB: Z-SCORE
WEALTH-LAB: Z-SCORE
We've created the z-score as a custom indicator, which is available at the Wealth-Lab.com website and in our Wealth-Lab Developer 2.1 desktop software.
The indicator takes two parameters. The series parameter specifies which price series (#open, #high, #low, #close, #volume or any user-created series) to base the z-score on. The period parameter controls the number of bars of data to use when calculating z-score.
The Wealth-Lab script given here plots the 20-day z-score, and 20-day, two-standard-deviation Bollinger Bands (Figure 5). It also implements a simple trading system based on the idea presented in the article. The system goes long when three-day smoothed z-score crosses above the 5/3 day smoothed z-score, and the lowest recent z-score was below -2. The long position is closed when a high price touches the upper Bollinger Band. The system rules are reversed for short positions.

Figure 5: Wealth-Lab, Z-SCORE. This sample Wealth-Lab chart plots the 20-day z-score and 20-day two-standard-deviation Bollinger Bands.
{$I
'ZScore'}
var ZSMA3, ZSMA3_5:  integer;
var Bar: integer;
var Z, ZScorePane, BBUp, BBDown:  integer;   { Plot ZScore and Bollinger
Band Indicators  }
ZScorePane := CreatePane( 100, true, true );
Z := ZScoreSeries( #Close,  20 );
BBUp := BBandUpperSeries( #Close, 20, 2 );
BBDown :=  BBandLowerSeries( #Close, 20, 2 );
PlotSeries( Z, ZScorePane, 766, #Thin  );
DrawLabel( 'ZScore(Close,20)', ZScorePane );
PlotSeries( BBUp, 0, 509,  #Thick );
DrawLabel( 'BBandUpper(Close,20,2)', 0 );
PlotSeries( BBDown, 0,  509, #Thick );
DrawLabel( 'BBandLower(Close,20,2)', 0 );
ZSMA3 :=  SMASeries( Z, 3 );
ZSMA3_5 := SMASeries( ZSMA3, 5 );
PlotSeries( ZSMA3,  ZScorePane, 830, #Thick );
PlotSeries( ZSMA3_5, ZScorePane, 940, #Thick  );   { Trading System Rules }
for Bar := 40 to  BarCount - 1 do
begin
  case MarketPosition of
     0:
    begin
      if CrossUnder(  Bar, ZSMA3, ZSMA3_5 ) then
        if  Highest( Bar, Z, 10 ) > 2  then
          ShortAtMarket(  Bar + 1, '' );
      if CrossOver( Bar, ZSMA3,  ZSMA3_5 ) then
        if Lowest( Bar, Z,  10 ) < -2 then
           BuyAtMarket( Bar + 1, '' );
    end;
     1:
    begin
      if CrossOver(  Bar, #High, BBUp ) then
         SellAtMarket( Bar + 1, LastPosition, '' );
     end;
    -1:
     begin
      if CrossUnder( Bar, #Low, BBDown )  then
        CoverAtMarket( Bar + 1,  LastPosition, '' );
    end;
   end;
end;
--Dion Kurczek, Wealth-Lab, Inc.
www.wealth-lab.com
![]() WEALTH-LAB: ZIGZAG TARGETS
WEALTH-LAB: ZIGZAG TARGETS
We programmed William Cringan's zigzag targets strategy in Wealth-Lab Developer. The script is available at our Wealth-Lab.com website, where you can execute it and see the results for any US stock symbol. Wealth-Lab provides a robust programming environment, so you can test complex strategies such as this without having to revert to an outside programming environment such as Visual Basic or C++. Our script implements the following concepts from Cringan's article:
1. An 8% zigzag is constructed and drawn on the chart (Figure 6).
Figure 6: WEALTH-LAB, ZIGZAG TARGETS. Here is a sample Wealth-Lab chart showing zigzag legs and targets. An 8% zigzag is displayed. The background of the chart is colored to indicate which zone the zigzag is currently in. The deviation oscillator is displayed in the lower pane.
2. The zigzag up and down moves are broken down into three zones each. The background of the chart is colored to indicate which zone the zigzag is currently in. The following color scheme is used:3. The deviation oscillator is constructed and plotted in a pane below the prices (Figure 6).Buy1 = Blue Buy2 = Green Sell2 = Red Sell1 = Tan4. The correlation matrix is constructed and populated with values.
5. The matrix is printed to the Wealth-Lab Developer debug window (Figure 7). If you are using Wealth-Lab Developer to run this script, you can copy the matrix directly from the debug window and paste it into Excel for more detailed analysis.
Figure 7: WEALTH-LAB, ZIGZAG CORRELATION MATRIX. The Wealth-Lab script that produced the chart in Figure 6 also creates the correlation matrices for up moves and down moves. The matrices are written to the Debug Window, and from there you can copy and paste them into a spreadsheet program for more detailed analysis.
6. An analysis of the current bar is performed and the results are printed on the chart. The analysis reports which group the deviation oscillator is currently in. It also uses the correlation matrix to report the likely zigzag zone for the current bar.
{$I 'ZigZag  Study'}   function  GetZoneGroup( x: float ): integer;
begin
  if x > 80  then
    Result := 4
  else if x < -80  then
    Result := 1
  else if x > 20  then
    Result := 3
  else if x < -20  then
    Result := 6
  else if x > 0  then
    Result := 2
  else
     Result := 5;
end;   function  GetDevGroup( DevVal: float ): integer;
begin
  Result := Trunc( (  DevVal + 100 ) / 20 ) + 1;
  if Result > 11  then
    Result := 11;
end;   var EMA40, Diff,  DevOsc, Bar, DevPane, ZoneSeries, b, Last: integer;
var DevHigh, DevLow,  Normalized, Range, p, t, x: float;
var B1, B2: integer;   { Plot an 8 % Zig  Zag }
HideVolume;
ZigZag( 8 );   { Plot 40 period  EMA }
EMA40 := EMASeries( #Close, 40 );
PlotSeries( EMA40, 0, #Green,  #Thick );   { Create Deviation  Oscillator }
Diff := SubtractSeries( #Close, EMA40 );
DevOsc :=  CreateSeries;
for Bar := 80 to BarCount - 1 do
begin
  DevHigh :=  Highest( Bar, Diff, 80 );
  DevLow := Lowest( Bar, Diff, 80 );
   if GetSeriesValue( Bar, Diff ) > 0 then
    Normalized :=  GetSeriesValue( Bar, Diff ) * 100 / DevHigh
  else
     Normalized := -GetSeriesValue( Bar, Diff ) * 100 / DevLow;
   SetSeriesValue( Bar, DevOsc, Normalized );
end;   { Plot Deviation  Oscillator }
DevPane := CreatePane( 100, false, true );
SetPaneMinMax(  DevPane, -120, 120 );
PlotSeries( DevOsc, DevPane, #Navy, #Thin  );
DrawHorzLine( 0, DevPane, #Navy, #Thin );
DrawLabel( 'Deviation  Oscillator', DevPane );   { Create 20% Price  Zones
for ZigZag moves }
ZoneSeries := SubtractSeriesValue( CreateSeries,  9999 );   Last := -1;
for  Bar := 200 to BarCount - 1 do
begin
  B1 := PeakBar( Bar, #Close, 8  );
  if B1 = Last then
    Continue;
  Last :=  B1;
  B2 := TroughBar( B1, #Close, 8 );
  for b := B2 to B1  do
    if b1 <> b2  then
      SetSeriesValue( b, ZoneSeries, ( b - b2 )  * 100 / ( b1 - b2 ) );
end;
Last := -1;
for Bar := 200 to BarCount - 1  do
begin
  B1 := TroughBar( Bar, #Close, 8 );
  if B1 = Last  then
    Continue;
  Last := B1;
  B2 :=  PeakBar( B1, #Close, 8 );
  for b := B2 to B1 do
     SetSeriesValue( b, ZoneSeries, -( 100 - ( ( b - b2 ) * 100 / ( b1 - b2
) ) )  );
end;   { Color background  based on which zone it belongs to }
for Bar := 200 to BarCount - 1  do
begin
  x := GetSeriesValue( Bar, ZoneSeries );
  if ( x  >= 0 ) and ( x <= 20 ) then
    SetBackgroundColor( Bar,  787 )
  else if x > 80 then
    SetBackgroundColor(  Bar, 877 )
  else if ( x <= 0 ) and ( x >= -20 )  then
    SetBackgroundColor( Bar, 778 )
  else if ( x  < -80 ) and ( x >= -100 ) then
    SetBackgroundColor(  Bar, 887 );
end;   { Create  Correlation Matrix }
type TMatrix = array[1..11] of array[1..6] of  float;
var arUp: TMatrix;
var arDown: TMatrix;
var ZoneVal, DevVal:  float;
var ZoneGroup, DevGroup, DevGroupPrev: integer;
DevGroupPrev :=  -1;
for Bar := 200 to BarCount - 1 do
begin
  ZoneVal :=  GetSeriesValue( Bar, ZoneSeries );
  ZoneGroup := 4;
  x :=  GetSeriesValue( Bar, ZoneSeries );
  ZoneGroup := GetZoneGroup( x  );
  DevVal := GetSeriesValue( Bar, DevOsc );
  DevGroup :=  GetDevGroup( DevVal );
  if DevGroup <> DevGroupPrev  then
    if DevGroupPrev > 0  then
      if ZoneVal >= -100  then
       begin
        if DevGroup >  DevGroupPrev then
           arUp[DevGroup][ZoneGroup] := arUp[DevGroup][ZoneGroup] +  1
         else
           arDown[DevGroup][ZoneGroup] := arDown[DevGroup][ZoneGroup] +  1;
      end;
  DevGroupPrev :=  DevGroup;
end;   { Dump matrix to  debug window }
var s: string;
Print( 'Correlation Matrix for Up moves'  );
for DevGroup := 1 to 11 do
begin
  s := '';
  for  ZoneGroup := 1 to 6 do
    s := s + FloatToStr(  arUp[DevGroup][ZoneGroup] ) + #9;
    Print( s  );
end;
Print( 'Correlation Matrix for Down moves' );
for DevGroup := 1  to 11 do
begin
  s := '';
  for ZoneGroup := 1 to 6  do
    s := s + FloatToStr( arDown[DevGroup][ZoneGroup] ) +  #9;
    Print( s );
end;   { Analysis of  Current Situation }
procedure Predict( ar: TMatrix );
begin
  var  z: integer;
  var HighVal: float;
  HighVal := -1;
  for  z := 1 to 6 do
    if ar[DevGroup][z] > HighVal  then
    begin
      ZoneGroup :=  z;
      HighVal :=  ar[DevGroup][z];
    end;
  s := 'Predicted Zone  ZigZag Zone: ';
  case ZoneGroup of
     1:
      s := s + 'Buy 2';
     2:
      s := s + 'Long';
     3:
      s := s + 'Sell 1';
     4:
      s := s + 'Sell 2';
     5:
      s := s + 'Short';
     6:
      s := s + 'Buy 1';
  end;
   DrawLabel( s, DevPane );
end;   x :=  GetSeriesValue( BarCount - 1, DevOsc );
DevGroup := GetDevGroup( x  );
DrawLabel( 'Deviation Oscillator is currently in Zone: ' + IntToStr(
DevGroup ), DevPane );
for Bar := BarCount - 2 downto 0 do
begin
   DevGroupPrev := GetDevGroup( GetSeriesValue( Bar, DevOsc ) );
  if  DevGroupPrev <> DevGroup then
  begin
    if  DevGroup > DevGroupPrev then
     begin
      DrawLabel( 'Moved up from Zone: ' +  IntToStr( DevGroupPrev ), DevPane );
      Predict(  arUp );
    end
     else
    begin
      DrawLabel(  'Moved down from Zone: ' + IntToStr( DevGroupPrev ),
DevPane  );
      Predict( arDown );
     end;
    Break;
  end;
end;
--Dion Kurczek, Wealth-Lab, Inc.
www.wealth-lab.com
![]() NEUROSHELL TRADER: Z-SCORE
NEUROSHELL TRADER: Z-SCORE
The z-score indicator described in Veronique Valcu's article in this issue is already one of the standard indicators in NeuroShell Trader's library of 800+ indicators. You can easily insert the z-score indicator into a chart (Figure 8) as follows:

Figure 8: NEUROSHELL TRADER, Z-SCORE. Here's a sample NeuroShell Trader chart demonstrating Bollinger Bands and the z-score indicator.1. Select "New Indicator ..." from the "Insert" menu.
2. Select the "Statistical" indicator category.
3. Select the "Standard Normal: Z-Score" indicator.
4. Change time series and periods parameters as desired.
5. Press the Finish button.
You can insert the Bollinger Band indicators as follows:
1. Select "New Indicator ..." from the Insert menu.
2. Select the "Time Series" indicator category.
3. Select both the "Bollinger Band High" and "Bollinger Band Low" indicators.
4. Change the period parameters to 20.
5. Press the Finish button.
To create the NeuroShell Trading Strategy described by Valcu, you
first need to create two moving averages of the z-score.
1. Select "New Indicator ..." from the Insert menu.
2. Select the "Simple Moving Average" category.
3. Select the "Simple Moving Average" indicator.
4. Change the Time Series to the z-score indicator.
5. Change the period parameter to 3.
6. Press the Finish button.
Right-mouse-click on the indicator you created, select the rename
option, and name the indicator "3-day Mvg Avg."
Next, create another simple moving average and this time change the time series to the three-day Mvg Avg and change the period parameter to 5. Rename this indicator "5-day Mvg Avg."
Next, select "New Trading Strategy ..." from the Insert menu and enter the following long and short entry conditions in the appropriate locations in the Trading Strategy Wizard:
Generate a Buy Long order if the following is true:
Generate a Sell Short order if the following is true:A > B 3 Day Mvg Avg > 5 Day Mvg Avg
If you own NeuroShell Trader Professional or NeuroShell DayTrader Professional, you can use the Optimizer to find the best parameters for these trading rules.A < B 3 Day Mvg Avg < 5 Day Mvg Avg
Users of NeuroShell Trader can go to the STOCKS & COMMODITIES section of the NeuroShell Trader free technical support website to download the sample chart with the z-score trading system.
For more information on NeuroShell Trader, visit www.NeuroShell.com.
--Marge Sherald, Ward Systems Group, Inc.
301 662-7950, sales@wardsystems.com
www.neuroshell.com
![]() NEOTICKER: Z-SCORE
NEOTICKER: Z-SCORE
To implement in NeoTicker the concept presented in the article "Z-Score Indicator" by Veronique Valcu, we will need to create an indicator called zscore (Listing 1) with period as the parameter.
To create this indicator in NeoTicker, go to the main window menu and select Program> Script Editor> New. This will open a new script editor window. From the script editor menu, select Indicator> Setup.
At the Indicator Specification window, fill in the fields as follows:
Function:   zscore
Description: Z-Score
Language: Formula
Right-click on the User Parameter space and select "Add."
Name the newly created parameter "Period," and set its default
to 20. Press "Apply" to save the settings.
Next, enter the code shown in Listing 1. After entering the code, click on "Indicator> Install." The indicator will then be installed and ready for applying to a chart.
LISTING 1
plot1 := (data1-average(data1, param1))/stddev(data1, param1);
Now, you can create a daily chart of the Dow Jones Industrial Average
(Figure 9). To do so, first add the Dow Jones daily to the chart,
then add the z-score indicator, and finally, add the standard deviation
lines by adding the indicator called "Constant Three Lines."
Change the values of Constant 1: 2, Constant 2: 0, and Constant 3: -2.

Figure 9: NEOTICKER, Z-SCORE. Here's a sample chart of the Dow Jones Industrial Average in NeoTicker with the z-score indicator and standard deviation envelope.
To create the chart with three- and five-period smoothings of the
z-score indicator (Figure 10), first add the z-score indicator to the chart.
Next, select the z-score indicator by clicking on the label on the upper
left-hand side of the chart. Right-click on the label, and select "Add
Indicator" from the popup menu. Select "Moving average"
from the "Add indicator" dialogue, and change the period
to 3. This will create a three-period smoothing of the z-score indicator.
Follow the same steps and add a five-period simple moving average.
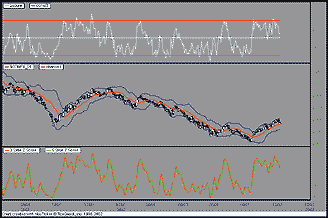
Figure 10: NEOTICKER, Z-SCORE. This chart contains three- and five-period smoothings of the z-score indicator.
A downloadable version of this indicator is available from the Yahoo!
NeoTicker user group file area at https://groups.yahoo.com/group/neoticker/.
--Kenneth Yuen, TickQuest Inc.GO BACK
www.tickquest.com
![]() TradingSolutions: Z-SCORE
TradingSolutions: Z-SCORE
In her article "Z-Score Indicator" in this issue, Veronique Valcu presents an overview of using the statistical z-score for analyzing prices relative to their Bollinger Bands.
The z-score can be calculated in TradingSolutions as follows:
This function is available in a function file that can be downloaded from the TradingSolutions website in the Solution Library section. A sample chart is shown in Figure 11.Z-Score Indicator Name: ZScore Inputs: Price, Period Div (Sub (Price, MA (Price, Period)), StDev (Price, Period))
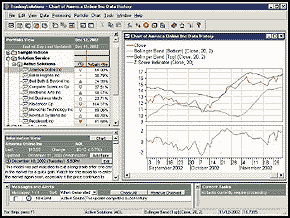
Figure 11: TRADINGSOLUTIONS, Z-SCORE. This chart displays price, Bollinger Bands, and the z-score indicator.
As with many indicators, functions like the z-score indicator can
make good inputs to neural network predictions. If used directly, you will
want to set the preprocessing to "None," since the value
stays within a specific range, or "Change" if the momentum
of the indicator is desired.
--Gary Geniesse, NeuroDimension, Inc.
800 634-3327, 352 377-5144
www.tradingsolutions.com
![]() INVESTOR/RT: Z-SCORE INDICATOR
INVESTOR/RT: Z-SCORE INDICATOR
The z-score indicator can be calculated in Investor/RT using a custom indicator. The syntax for the custom indicator is simply:
The moving average token represents a 20-period simple moving average, while the Stat (statistics) token represents a 20-period standard deviation. Figure 12 shows the custom indicator window setup for z-score.(CL - MA) / STAT
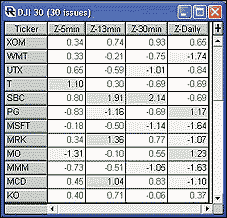
Figure 12: INVESTOR/RT, Z-SCORE CUSTOM INDICATOR. This Investor/RT custom indicator calculates the z-score. CL represents the closing price, MA represents the 20-period simple moving average, and STAT is the statistics indicator representing a 20-period standard deviation of price.
After creating the z-score custom indicator, it can now be added
to charts and quotepages. First, we'll add the five-minute, 13-minute,
30-minute, and daily z-score to a quotepage using four custom columns.
All four custom columns will just reference our z-score custom indicator,
but each will be based on a different periodicity. Each custom column is
also set up with rules to highlight in green when the value is greater
than 1, and highlight in red when the value is below -1. The resulting
quotepage can be seen in Figure 13.
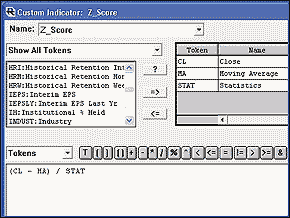
Figure 13: INVESTOR/RT, Z-SCORE QUOTEPAGE. This Investor/RT QuotePage shows the Dow 30 and has four custom columns added to it. They represent the five-minute, 13-minute, 30-minute, and daily z-scores, respectively. Green backgrounds highlight values over 1, while red backgrounds highlight values under -1.
Now, we'll add the z-score to a chart. Figure 14 shows a
daily chart of Mrk. In the top pane, you can see the 1 (red) and 2 (green)
standard deviation Bollinger Bands overlaying the daily candlesticks. In
the lower pane, the z-score is charted. Notice when the candles rise above
the upper two standard deviation Bollinger Band, the z-score reflects this
with a value above 2.
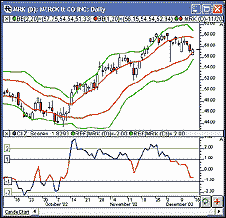
Figure 14: INVESTOR/RT, Z-SCORE CHART. This is an Investor/RT daily candlestick chart of MRK (Merck & Co, Inc.). In the upper pane, the candlesticks are overlaid with Bollinger Bands of one (red) and two (green) standard deviations. The lower pane shows the z-score drawn as a two-color line.
--Chad Payne, Linn Software
800-546-6842, info@linnsoft.com
www.linnsoft.com
![]() INVESTOR/RT: ZIGZAG TARGETS
INVESTOR/RT: ZIGZAG TARGETS
The deviation oscillator can be calculated in Investor/RT using a custom indicator. The syntax for the custom indicator is simply:
(OSC > 0) * (100*OSC/MAX(OSC,80))
+ (OSC <= 0) * (100*(OSC)/ABS(MIN(OSC,80)))
Figure 15 shows the custom indicator window setup for the deviation
oscillator (DevOsc).
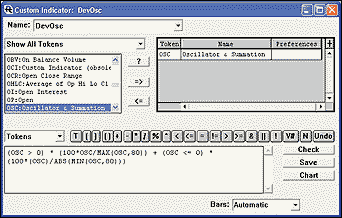
Figure 15: INVESTOR/RT, ZIGZAG CUSTOM INDICATOR. This Investor/RT custom indicator calculates the deviation oscillator (DevOsc). OSC represents the oscillator & summation indicator, with the preferences shown in Figure 17.
The "OSC" token represents the Oscillation & Summation
indicator. In this case, it's a setup with the preferences seen
in Figure 16. This setup gives you an oscillator that represents the difference
between the closing price and the 40-period exponential moving average.
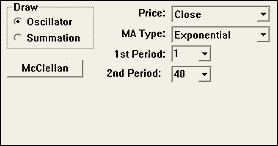
Figure 16: INVESTOR/RT, ZIGZAG PREFERENCES. Here are the preferences used for the oscillator & summation (OSC) indicator for the deviation oscillator custom indicator shown in Figure 16.
After creating the DevOsc custom indicator, it can now be added
to charts (or custom columns in quotepages, and so on). Figure 17 shows
a daily continuous line chart of Csco. The upper pane has the closing price
data (in black) overlaid with a 5% zigzag (in red) and a 40-period exponential
moving average (in gold).
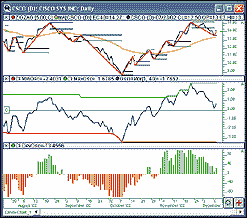
Figure 17: INVESTOR/RT, ZIGZAG chart. Here is an Investor/RT daily continuous line chart of CSCO overlaid with a 5% zigzag drawn in red. The blue lines show where the 5% levels are on each leg. The gold line represents a 40-period exponential moving average. In the bottom pane, the deviation oscillator is charted as a histogram.
The blue line in the middle pane depicts the oscillator (OSC) with
the preferences seen in Figure 16. The green line at the top reflects the
maximum value of Osc over the past 80 periods. Similarly, the red line
at the bottom reflects the minimum value of Osc over the past 80 periods.
These three lines are used in the eventual calculation of the deviation
oscillator, which is drawn as a histogram in the lower pane of the chart.
GO BACK
--Chad Payne, Linn Software
800-546-6842, info@linnsoft.com
www.linnsoft.com
![]() AIQ EXPERT DESIGN STUDIO: Z-SCORE
AIQ EXPERT DESIGN STUDIO: Z-SCORE
Here is the code for use in AIQ's Expert Design Studio based on Veronique Valcu's article in this issue, "The Z-Score Indicator." A sample chart is in Figure 18.
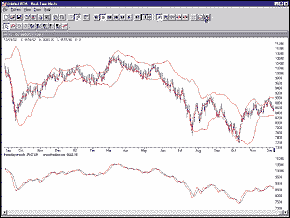
Figure 18: AIQ, Z-SCORE. Here is a sample AIQ chart of the z-score indicator.
!!! Stocks & Commodities February 2003
!!!  Z-Score Indicator by Veronique Valcu
close is [close].
zscore is close - simpleavg(close, 20) / sqrt(variance(close, 20)).
threedaysmooth is simpleavg(zscore, 3).
smoothedzscore is simpleavg(threedaysmooth, 5).
--Mike KadenGO BACK
Aiq Systems
www.aiq.com
![]() SMARTRADER: Z-SCORE
SMARTRADER: Z-SCORE
The z-score indicator described by Veronique Valcu is built in SmarTrader by first creating Bollinger Bands. A template for Bollinger Bands is available in the SmarTrader Library. The template includes a "typical price," which we have eliminated in this example for clarity.
A SmarTrader specsheet is shown in Figure 19. The rows for Bollinger Bands consist of a 20-period simple moving average of the close, a 20-period standard deviation of the close, and two user rows for the calculation of the bands.
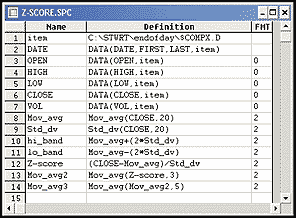
Figure 19: SMARTRADER, Z-SCORE SPECSHEET. Here's a SmarTrader specsheet for calculating the z-score. The rows for Bollinger Bands consist of a 20-period simple moving average of the close, a 20-period standard deviation of the close, and two user rows for the calculation of the bands.
Row 12, z-score, is a user row to calculate the z-score using the
formula in the article. Row 13, Mov_avg2, is a three-period simple moving
average of z-score. Row 14, Mov_avg3, is a five-period simple moving average
of the three-period moving average.
We have plotted the 20-period moving average of the close and the hi_band and lo_band calculations over the bar chart (Figure 20). Z-score is plotted in its own window with level lines set at +2, 0 and -2. In a third window, we have plotted the two moving averages of z-score.
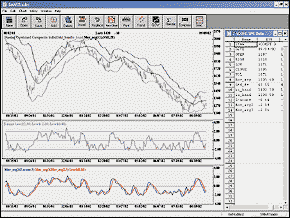
Figure 20: SMARTRADER, Z-SCORE CHART. Plotted here are the 20-period moving average of the close and the hi_band and lo_band calculations over the bar chart. Z-score is plotted in its own window with level lines set at +2, 0 and -2. In a third window, the two moving averages of z-score are plotted.
--Jim Ritter, Stratagem Software
504 885-7353, Stratagem1@aol.com
![]() WALL STREET ANALYZER: Z-SCORE
WALL STREET ANALYZER: Z-SCORE
In "Z-Score Indicator" in this issue, Veronique Valcu explains how to create a new kind of Bollinger Bands model. The z-score can be easily reproduced using Wall Street Analyzer.
To chart the z-score (Figure 21), create a new indicator and enter following code:
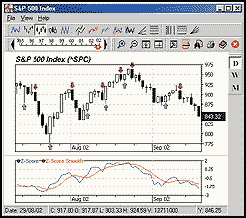
Figure 21: WALL STREET ANALYZER, Z-SCORE. Here's the z-score plotted in Wall Street Analyzer.
' Z-Score
Sub Main()
  Period = 20
  CloseArr = GetClose
  ZScArr = Substract(CloseArr, SMA(CloseArr, Period))
  ZScArr = Divide(ZScArr, StdDev(CloseArr, Period))
  SetIndic(ZScArr)
End Sub
To add the smoothed z-score as seen in the article, just add a new
indicator and enter this code:
' Z-Score Smooth
Sub Main()
  Period = 5
  SmArr = SMA(GetIndic("Z-Score"), Period)
  SetIndic(SmArr)
End Sub
A simple system based on this indicator can be constructed
by creating a new system and entering this code:
' Z-Score based system
Sub Main()
  Period = 5
  TArr = GetIndic("Z-Score")
  TArr2 = SMA(TArr, Period)
  For CurrentBar = BeginBar to EndBar
    If Cross(TArr, TArr2, CurrentBar) then Buy(CurrentBar)
    If Cross(TArr2, TArr, CurrentBar) then Sell(CurrentBar)
  Next
End Sub
Note that this code can be optimized. Note also that this
is only a template for more sophisticated trading rules.
--Frederic D. Collin, Wall Street Analyzer
www.Lathuy.com
![]() WAVE WI$E MARKET SPREADSHEET: Z-SCORE
WAVE WI$E MARKET SPREADSHEET: Z-SCORE
The following Wave Wi$e formulas calculate the z-score indicator:
 A: DATE @TC2000(C:\TC2000V3\Data,DJ-30,Dow Jones Industrials,DB)
 B: HIGH
 C: LOW
 D: CLOSE
 E: OPEN
 F: VOL
 G:
 H: z_score (CLOSE-@MAVG(CLOSE,20))/@STD(CLOSE,20)
 I:               ' ==========End Spreadsheet Formulas
--Peter Di Girolamo, Jerome Technology
908 369-7503, jtiware@aol.com
https://members.aol.com/jtiware
![]() FINANCIAL DATA CALCULATOR: Z-SCORE
FINANCIAL DATA CALCULATOR: Z-SCORE
Creating the z-score indicator in Financial Data Calculator is simply done by creating a macro. In the Macro Wizard, simply enter:
A:  Close #R
B:  #L movave A
C:  #L movstdv A
(A ? B)/C
Then name the macro "zscore," and use in any expression,
such as: "20 zscore ibm", or a smoothed version, such as
"3 movave 20 zscore msft."
Note that the #R in the macro description refers to the right argument
or the target dataset, whereas the #L refers to the number of days or bars.
The left argument (#L) is not required to be a fixed number (such as 10),
but can itself be a dataset, making your new macro totally adaptive. You
can also make the Bollinger Band macro adaptive in the same way.
--William RafterGO BACK
Futures Software Associates, Inc.
www.futures-software.com
All rights reserved. © Copyright 2003, Technical Analysis, Inc.
Return to February 2003 Contents
