STOCKFETCHER.COM
One of the fascinating things about the technology sector implosion has been the movement by many technology product manufacturers to load more and more features into and onto a given product. Thus, not only do we have personal computers that surf the web, play music, and edit digital video, but we also have cell phones that take photographs and refrigerators with flat-screen Lcd monitors.
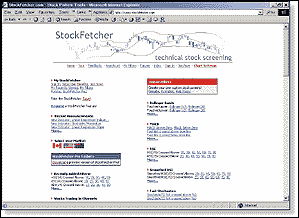
I thought of this as I visited what might be the "mother of all technical stock screeners," better known as a website called StockFetcher.com (Figure 1). For just $9 per month, investors and traders who subscribe to StockFetcher get access to a truly dizzying array of technical indicators - from price channels and new highs/new lows to stochastics, Bollinger Bands, and candlesticks. For those technically based traders and investors who have occasionally felt that individual stocks were virtually immune to the interpretive power of technical analysis, StockFetcher provides the sort of technical screens that will help traders narrow the universe of stocks to just those equities that fall into given trading criteria.
Before I go any further, let me count the ways StockFetcher filters stocks: average directional movement index (ADX), directional movement index (DMI), price channels, new highs/new lows, price against moving average, volume and average volume, moving average crossovers, Bollinger Bands, moving average convergence/divergence (MACD), relative strength index (RSI) and smoothed RSI, fast and slow stochastics, candlesticks, average true range, Williams' %R, the money flow index, on-balance volume, commodity channel index (CCI), comparative relative strength, Chaikin volatility, and the mass index. Don't see your favorite indicator? Don't fret - just send StockFetcher e-mail about the indicator you would like to see added to their catalog of filters and, chances are, StockFetcher will comply.
FETCHING CHAINS
StockFetcher encourages its members to set up what it calls "filter chains," which can consist of up to 30 different technical stock screens, providing a progressively more discriminating list of stocks. StockFetcher can create historical filter chains in order to see how a particular stock that fits a certain technical profile actually performed over a given period of time. This is an excellent way of backtesting screens and filter chains to determine whether they actually provide a set of stocks that will act the way the trader or investor expects. For example, a given filter chain that a trader believes will point to stocks that are breaking out to new highs may, upon reviewing the filter performance history, actually reveal stocks that are prone to false breakouts. Too often, backtesting has been the sole domain of systems testers. With StockFetcher, stock screeners have the same level of scrutiny when it comes to their stock screens and filters.
For stocks, StockFetcher also provides watchlists with up to 200 different stock symbols. Combined with the filter chaining feature, the watchlists can readily tip off the trader when one of the stocks on the list appears ready to meet a particular technical condition. Unlike most stock watchlists, which are usually limited to price and volume information, StockFetcher's watchlists can be used to provide instant information about which stocks are not only moving up or down, but also are getting closer to a condition in which they can be traded based on the trader's qualifications. An e-mail feature can also be set up to mail the trader a copy of the watchlist and stock screens to see if any stocks are close to being ready to trade.
After spotting a stock that appears to be ready to be traded by meeting some particular criteria, StockFetcher provides a Historical Analysis page that includes price charts and a table of recent performance over a variety of time frames, from one day up to one month. More specifically, the Historical Analysis page shows the occurrences when the stock actually matched the criteria, as well as how the stock performed in various time frames (one day, one week, and so on) since. Again, this ability to see how a stock performed after meeting stated criteria is a key feature of StockFetcher. Not only does this keep traders from blindly trading stocks just because the stocks meet a certain technical criteria, but the feature also helps traders create ever more effective stock screens and filter chains.
SECTORS, BETAS, AND BEYOND
In addition, StockFetcher allows for stock screens and filters based on sector, which is a powerful complement to individual stock analysis. The sector filtering is as seamless a process as the stock filtering; sectors are simply considered to be just another variable. This feature also helps traders get a sense of whether stocks in a given sector respond to certain technical characteristics in a similar fashion, allowing the trader to compare the performance of peer stocks in order to, for example, buy the strong and short the weak.
StockFetcher has also released a beta version called StockFetcher Pro that is available as a free download from StockFetcher.com. Although the beta of StockFetcher Pro does not have all the features the final version will have, it is a worthwhile look at where the developers of StockFetcher are headed. And for those who find StockFetcher particularly helpful, working with the beta product is an excellent way of influencing the ongoing development.
In short, those who trade stocks based on technical criteria owe it to themselves to give StockFetcher a try. Unlike many other stock screens (such as those provided in TC2000), there is no programming language whatsoever that StockFetcher members need to be concerned about. Fortunately, given the variety of filter types in StockFetcher, this is not a handicap in the slightest. By providing a wealth of different technical criteria (and being open to creating more based on member interest) and a seamless way of moving from watchlist to filter chain to historical analysis, StockFetcher lets traders and investors focus on what matters most: trading and investing.
David Penn is a Staff Writer for STOCKS & COMMODITIES.

Figure 1: stockfetcher.com. Could this be the mother of all technical stock screens?
CHARTWARE.DE
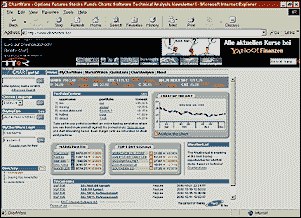
In my quest to identify websites focused on technical analysis, I stumbled upon www.chartware.de. This site, hosted in Germany, lets viewers read the site either in German or English. I assumed the site would have a focus on European stocks, but was surprised to find stocks traded on the US exchanges on the homepage's streaming ticker tape. You can see what the site has to offer immediately by taking a glance at the homepage: Users can get quotes, analyze charts, get an overall market view, get buy/sell ratings, and be a part of a trading community.
Take a look the "Chart of the day" on the homepage. By placing your mouse over the "Analyse this chart" link, you can see what features are available. The technical analysis option is the most interesting. This shows you a chart with closing prices plotted, and with the 200- and 38-day moving averages overlaid. (Why the 38-day moving average? It's a mystery to me.)
Other indicators included are Fibonacci retracements, Fibonacci stress days, and Bollinger Bands plotted as horizontal lines. You'll also see a price forecast for the next 12 days. Comment and explanation tabs below the chart provide further insight into the analysis. A short commentary gives buy and sell ratings, and there are discussions of the technical tools and indicators used. The strength or weakness of the securities are displayed using weather symbols, which I found to be a unique touch. The sunny symbol indicates the situation is very positive and you should go long, while the thunderstorm symbol, at the other extreme, suggests an extremely negative situation where you should go short.
There are additional technical indicator tools worth mentioning. These include the five-year and one-year trendlines, candlestick charts, various indicators, volatility charts, and statistics of returns and volatility. The candlestick charts are explained clearly with the most recent patterns highlighted, and with a commentary that will help users understand the logic behind the projections.
Across the top of the page you will notice various tabs: Home, MyChartWare, MarketWatch, QuoteLists, and ChartAnalysis. The features available on the site are numerous. You can scan for tradables including stocks, currencies, interest rates, and some commodities. If you see one you like, you can add it to your quote lists or portfolio. You also have the option to set an e-mail alert when a security hits a certain price.
Other features are the top five lists for the Dow Jones industrials, Nasdaq 100, Standard & Poor's 500, FTSE 100, Estoxx 50, and the Nikkei 225. These lists can be arranged based on buy signals, the current day's percent change, percent change in one week, percent change in one month, and percent change in one year.
Those who have registered on the site (a free service) have the option of participating in discussions, as well as in a portfolio contest. The top five-ranked participants of the contest are listed on the homepage. If you click on the usernames of the contestants, you'll see their equity curves.
Overall, this is a well-designed site with many features a technical analyst will find useful. It's easy to lose yourself in browsing the site, and considering the content, I wouldn't be surprised if it attracts a large following. ChartWare.de is definitely worth a visit.

-Jayanthi Gopalakrishnan, Editor, STOCKS& COMMODITIES
Originally published in the February 2003 issue of Technical Analysis of STOCKS & COMMODITIES magazine. All rights reserved. © Copyright 2003, Technical Analysis, Inc.