CHARTING
Analyzing Fibonacci Level Behavior
Combining Fibonacci Retracements and the RSI
by Ingo W. Bucher
Combining the two can help identify significant support and resistance levels.
Many of you have used the relative strength index (RSI) and Fibonacci retracement levels independently, but have you ever considered analyzing the behavior of Fibonacci retracement levels on the RSI? It may seem remote, but this technique could have some advantages over the commonly used 70-30 overbought-oversold level of the RSI. In addition, there is a great deal of information between the overbought and oversold levels that could be exploited more effectively by combining traditional charting and Fibonacci ratios. I'll start by defining RSI.
THE RELATIVE STRENGTH INDEX (RSI)
The RSI compares the strength of price advances with respect to price declines over a specific time period. In 1978, J. Welles Wilder Jr. developed this indicator to overcome some of the inaccuracies of the simpler momentum oscillators. The term "relative strength" can be slightly misleading, because the indicator does not show the relationship between two different securities. Instead, it measures the internal strength of one security. The calculation of the RSI is provided in detail in the sidebar, "Relative strength index calculation."

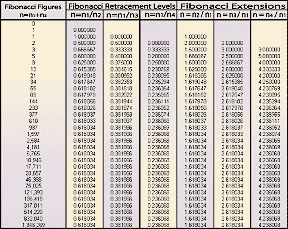
FIGURE 1: CALCULATING FIBONACCI NUMBERS. Here you see how the Fibonacci summation series, retracement, and extension levels are calculated.
...Continued in the March 2003 issue of Technical Analysis of STOCKS & COMMODITIES.
Excerpted from an article originally published in the March 2003 issue of Technical Analysis of STOCKS & COMMODITIES magazine. All rights reserved. © Copyright 2003, Technical Analysis, Inc.