INTERVIEW
Zen, Candlesticks, And The Trading Triad
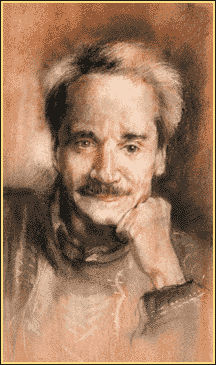
Steve Nison
by Jayanthi Gopalakrishnan
Want to know something about candlestick charting? Steve Nison can tell you. He was the first to bring Japanese candlestick charting methods to Western trading nearly 20 years ago. He is a leading authority on candlesticks, the author of two foundational books on the subject, Japanese Candlestick Charting Techniques and Beyond Candlesticks, and gives seminars on the subject. Further, Nison was one of the first to be awarded the designation of Chartered Market Technician (CMT) from the Market Technicians Association (MTA); in addition, he is president of CandleCharts.com, an educational and advisory website. Can candlestick patterns be useful to traders accustomed to Western-style technical analysis? It would seem so, considering they have become a staple for Western traders in the past two decades. STOCKS & COMMODITIES Editor Jayanthi Gopalakrishnan called Nison to discuss that subject on January 24, 2003.

Any form of technical analysis can be used on candle charts... you're getting all your bar chart signals, plus all the candle chart signals.
What got you interested in candlestick charting?
Back in the mid-1980s, I was working at a brokerage firm in New York, and there was a native Japanese broker there. She had clients in Japan. She would give stock recommendations on Nikkei stocks, and she would have chart books airmailed to her from Japan -- and all the chartbooks contained candlestick charts. Once I was in her office talking with her, and she was looking at one of these chartbooks, and that piqued my curiosity.
And that curiosity led you to learn more about them?
Right. She explained them to me a little, and then by coincidence I ran into an American who was a Japanese translator, and was going to Japan. I asked him to buy every book he could on candlesticks. He did, and for the next year or so, he translated them for me. In addition, I got in contact with the Nippon Technical Analysts Association, and they were very helpful.
Candlesticks are basically a visual technique. There are a great many patterns you can see. How do you determine which patterns are most reliable, as opposed to those that occur frequently?
The Japanese have a nice expression about that. They say that the personality of a stock or a market is like a person's face; no two are alike. With that in mind, some patterns are going to work better in certain markets than in others. Generally, though, one of the things I emphasize in my educational material is that the more signals confirm a support or resistance level, the more likely there will be a reversal.
Really? What's an example?
Suppose there's a candlestick signal, say a bullish engulfing pattern, which is when a white real body wraps around a black real body at a major support area. I would be much more likely to be aggressive on buying that particular market than I would be if a bullish engulfing pattern was not confirming support. One of the questions I'm frequently asked at my seminars is, "Which are the more powerful patterns?" I always say, "Show me the chart when you see a pattern," because your reaction to the pattern itself depends on the overall market environment of where that pattern forms.
...Continued in the April 2003 issue of Technical Analysis of STOCKS & COMMODITIES
Excerpted from an article originally published in the April 2003 issue of Technical Analysis of STOCKS & COMMODITIES magazine. All rights reserved. © Copyright 2003, Technical Analysis, Inc.
Return to April 2003 Contents