CYCLES
Real-Time Maps For Trading
Time And Money Charts
by Stuart Belknap, Ph.D.
Interested in a universal price display? This might be the ticket.
Whether you use indicators, automated setup and signal rules, or any other method, before opening or closing positions you probably read charts to identify patterns, interpret indicators, and apply line studies. Hence, your price display should be as helpful as possible. Your charts should clarify the development and repetition of patterns, cycles, and trends. They should accurately display relative price moves, gains, and losses. Most important, your charts should provide a functional, real-time map for trading tactics and money management.
There are, however, any number of ways to plot security price action depending on style and time frame, metrics, scaling, and calibration. Moreover, it is commonly held that individual securities have unique behaviors, requiring different indicators with different parameters at different times. Do things have to be this complicated? Maybe not.
This article introduces a universal price display based on time and money (TAM) charts with features independent of security, trading interval, and time frame. You may find the format convenient and functional insofar as the same indicators and line studies with fixed parameters apply in all cases with visually correct, scaled, and calibrated price moves and trendlines.

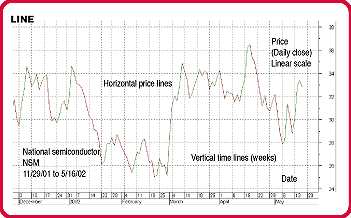
FIGURE 1: LINE CHART. This is the simplest form of a price chart.
...Continued in the May 2003 issue of Technical Analysis of STOCKS & COMMODITIES
Excerpted from an article originally published in the May 2003 issue of Technical Analysis of STOCKS & COMMODITIES magazine. All rights reserved. © Copyright 2003, Technical Analysis, Inc.
Return to May 2003 Contents