CHARTING
More Bull -- So To Speak
Uncommon Chart Patterns
by Thomas Bulkowski
Some bullish chart patterns are rare, and some are simply not well known. Read this to find out about both.
A few months ago, I received e-mail from someone asking about identification techniques for chart patterns. I suggested the e-mailer could buy one of my books, but short of a brain transplant, I could do little else. This article addresses the identification problem by highlighting guidelines for some lesser-known bullish chart patterns.
BROADENING FORMATIONS, RIGHT-ANGLED AND DESCENDING
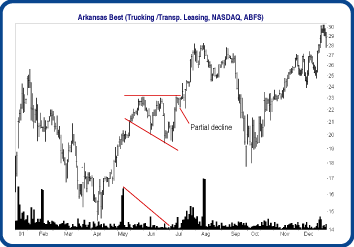
In Figure 1 you see a right-angled, descending, broadening formation. Its name comes from the broadening appearance of price action marked by descending lows. Note the horizontal trendline along the pattern top, forming an upper price boundary. The minor lows follow a downsloping trendline. Think of the formation as a megaphone tilted so that the top is horizontal but price action widens over time. The volume pattern is usually irregular, but in this case, it recedes.

FIGURE 1: RIGHT-ANGLED AND DESCENDING BROADENING FORMATION. A horizontal trendline on top and downsloping price trend on the bottom mark this chart pattern.
...Continued in the May 2003 issue of Technical Analysis of STOCKS
& COMMODITIES
Excerpted from an article originally published in the May 2003 issue of Technical Analysis of STOCKS & COMMODITIES magazine. All rights reserved. © Copyright 2003, Technical Analysis, Inc.
Return to May 2003 Contents