BASIC TECHNIQUES
Forecasting Trends With Indexes
Using Implied Volatility And Volume
by Scott Castleman
Construct a trend-following system that adjusts to current market conditions.
Traditionally, technicians have relied on historical prices to analyze the market. They have created many different indicators to predict the direction of prices by basing their calculations on past data. However, these indicators may fail to work prospectively when markets do not repeat their historical patterns. Thus, using these indicators to forecast market direction is like trying to drive a car by looking in the rearview mirror. Any change in the road ahead could lead to disaster.
When we are searching for ways to forecast the direction of the market, it is essential to characterize the market with current information. Two such ways of describing the market are with implied volatility and volume. Using implied volatility and volume as parameters, you should be able to construct a profitable trend-following system by adjusting the number of days referenced in a simple Donchian-style breakout system. This allows the system to adjust itself to reflect current market conditions.
IMPLIED VOLATILITY
The implied volatility is volatility that the market is currently anticipating for the underlying asset, which can be a futures contract, a stock, or an exchange-traded fund (ETF). Implied volatility is usually used for trading options on the underlying, but you can also use it to trade the underlying itself. Calculating volatility can be a problem, because you are trying to measure something that will occur in the future. Implied volatility is based on an expectation as opposed to a posted value, but it is a necessary component of any option pricing model.

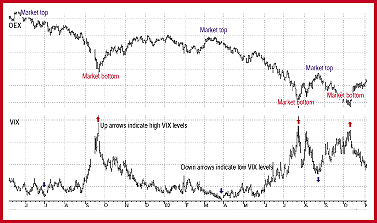
FIGURE 1: THE S&P 100 INDEX (OEX) VERSUS THE IMPLIED VOLATILITY INDEX OF THE S&P 100 OPTIONS (VIX). The top price chart is the S&P 100 index (OEX), and the bottom price chart is the implied volatility index of the S&P 100 options (VIX). The red up arrows indicate high levels of the VIX, while the blue down arrows indicate low levels. The high VIX levels reached in September 2001, July 2002, and October 2002 are associated with market bottoms. Low VIX levels reached in July 2001, March 2002, and August 2002 are associated with market tops.
...Continued in the June 2003 issue of Technical Analysis of
STOCKS & COMMODITIES
Excerpted from an article originally published in the June 2003 issue of Technical Analysis of STOCKS & COMMODITIES magazine. All rights reserved. © Copyright 2003, Technical Analysis, Inc.
Return to June 2003 Contents