INDICATORS
Determine The Beginning And The End
Trend Alert! With The CCI
by Martin Boot
The trend is your friend -- or is it?
How do you know when a trend has turned against you? There are only so many indicators that can alert you. Among them, one of the most helpful is the commodity channel index (CCI). Introduced by Donald Lambert in 1980, the CCI is a price momentum indicator that measures a security price's variance from its statistical mean. It is commonly considered useful in determining the beginning and end of a trend.
It does so effectively, but it can also be used in another way. When I was engaged in a major research project involving statistical analysis of more than 8,000 NYSE/Nasdaq stocks over a five-year period, I tested well-known technical indicators as well as technical patterns. The results were intriguing.
TRADITIONAL METHOD
The literature on the CCI contains a fairly consistent recipe for using this indicator. For example, Amy Wu stated in a STOCKS & COMMODITIES article that the CCI falls within the +/-100 range. When the index moves beyond this range, it suggests that the movements are no longer random, which creates trading opportunities. Hence, if the CCI rises above +100, it means that you should consider going long, and when it falls below +100, you should exit your position.
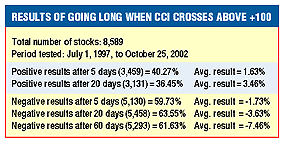
If the CCI crosses +100, tradition recommends that you enter a long position. However, many traders use this indicator in a different way: when the CCI crosses above +100, it indicates overbought conditions, meaning you should go short. A downward crossing of -100 suggests you go long. This provides an interesting point for statistical analysis. The results of going long when the CCI crosses above +100 are displayed in Figure 1.

FIGURE 1: USING THE TRADITIONAL METHOD. These results show that if you apply the traditional method found in most literature you will end up losing capital in the long run.
Using the CCI to go long when it crosses above +100 has a chance of being correct 50% of the time. That means all results below 50% are to be considered failures. None of the chosen time intervals yielded results over 41%. In other words, using the CCI to go long, as in the traditional method, will result in lost capital in the long run.
...Continued in the July 2003 issue of Technical Analysis of STOCKS & COMMODITIES
Excerpted from an article originally published in the July 2003 issue of Technical Analysis of STOCKS & COMMODITIES magazine. All rights reserved. © Copyright 2003, Technical Analysis, Inc.
Return to July 2003 Contents