Q&A
Explore Your Options
| Got a question about options? Tom Gentile is the chief options strategist at Optionetics (www.optionetics.com), an education and publishing firm dedicated to teaching investors how to minimize their risk while maximizing profits using options. To submit a question, post it on the STOCKS & COMMODITIES website Message-Boards. Answers will be posted there, and selected questions will appear in future issues of S&C. | 
Tom Gentile of Optionetics |
VOLATILITY
What exactly is volatility and how is it used to trade options? - S.L.
Volatility is simply the rate of change in a stock, index, or futures contract over a specific period of time. There are two types that we are concerned with when trading options: historical and implied. When speaking of the movement of the stock as it has occurred in the past, we're referring to historical volatility. After using a fairly complex formula to calculate historical volatility, we can use the result to "guesstimate" where a stock should end up over the same period of time. Implied volatility is the market's assumption of where the stock is going in the future, reflected (or implied) in its option price. The higher the implied volatility, the more the option's time value increases, making an option relatively more expensive.
Since there are many different types of options strategies to implement under various ranges in volatility, using a comparative analysis of the two types will help you assess the optimal strategy. For example, if the historical volatility of a stock over the last 90 days is 40%, but the average implied volatility of the at-the-money options is 50%, the market is making an assumption that the underlying will move by a greater degree than it has in the past. Therefore, the options will likely be more expensive relative to the past. Thus, you may wish to implement a strategy in which you are going to be a net seller of option premium, or sell a hedge against a long position to curb the costs.
Although historical volatility can be helpful, you can use an implied volatility analysis alone to create very profitable options strategies. Let's look at what's been happening lately in the market. For the first couple of months of 2003, the volatility index (VIX) was trading well above normal levels for an extended period of time. This is generally a good gauge of fear for the rest of the market, since the VIX represents the average implied volatilities of a series of at-the-money options on the Standard & Poor's 100. For the first quarter of this year there was a lot of focus on the war in Iraq, as well as the SARS breakout. During times of uncertainty like these, the "collective conscience" or mass opinion of the market is that bad news can lead to more bad news and eventually destructive losses, as we've seen over the last three years.
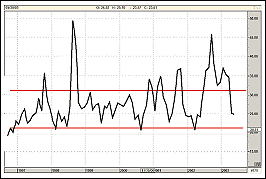
Since the latter 1990s, the VIX has pretty much stayed in the range of 20-30% (see Figure 1). Note how each time it touched the 20% level, it was soon followed by a run back up to 30%. This information can be very useful to the savvy options trader who takes on a contrarian approach. When the VIX sits at a level of 20, the market is generally overbought and the majority of the traders have turned bullish. So the basic question a good contrarian would ask at this point is, "If everyone has turned bullish, who is left to buy?" From there, you can piece together some pretty profitable strategies.

FIGURE 1: VOLATILITY INDEX. Since the latter 1990s, the VIX has mostly stayed in the 20-30% range.
IMPLIED VOLATITLITY
To what degree does an increase (or decrease) in implied volatility of the underlying affect the four strikes (in particular the strikes of the two short positions) of a long condor structure (made with either call or put options)? - R. Marchant
Since the long condor is essentially a long butterfly with two different strikes that make up the short body, the same rules apply to both strategies. They are ideal when the implied volatility is already high. Since the strategy is profitable as the time decays in the short options while the stock trades in a range, you want that time premium to collapse in the "body" as soon as possible. This is important, since the body is the most sensitive to changes in implied volatility with regard to price (known as vega). If implied volatility continues to increase, this can work against you by increasing the length of time it takes to profit. If time decays while implied volatility increases, the two may actually cancel each other out, keeping the position's value stable - which is what we don't want! However, if implied volatility comes down after the trade is placed, you can close the position sooner with a profit, provided the stock stays in the range suggested by its risk curve.
Keep in mind that if implied volatility increases on a position such as a long condor, chances are the stock is trending down. For the long condor, you want the stock to trade in a range somewhere between the two long strikes on or before expiration. Generally, an increase in volatility is an indication of fear priced into the options, which is generally indicative of the underlying selling off (though not always). During periods of such uncertainty, traders will often buy puts to protect their long stock positions, exacerbating a selloff and greatly affecting the condor position.
Return to July 2003 Contents
Originally published in the July 2003 issue of Technical
Analysis of STOCKS & COMMODITIES magazine.
All rights reserved. © Copyright 2003, Technical Analysis, Inc.