CHARTING THE MARKET
THE RELATIVE STRENGTH INDEX
Writing about his relative strength index (RSI) in 1978, J. Welles Wilder noted five different ways that the indicator could be helpful to investors and traders. These include identifying tops and bottoms; confirming chart patterns; looking for "failure swings"; gauging support and resistance; and spotting divergences between rising or falling indicator action versus price action. Wilder wrote:
Learning to use this index is a lot like learning to read a chart. The more a trader studies the interaction between chart movement and the relative strength index, the more revealing the RSI will become. If used properly, the RSI can be a very valuable tool in interpreting chart movement. The RSI points are plotted daily on a bar chart and when connected, form the RSI line.
For the majority of technically oriented traders, the days of plotting individual RSI points are likely a thing of the past. But this has not taken anything away from the utility of the index. In fact, as our reading list suggests, innovative traders and technical analysts have been using, modifying, rearranging, and even reverse-engineering Wilder's relative strength index - often with quite surprising (and profitable) results.
In Figure 1, a humbler version of the traditional 14-period relative strength index is shown against the price action of the Standard & Poor's 500 for the first half of 2003. Presented here are two instances of indicator/price divergences: a positive divergence in February/March and a negative divergence from mid-March into late May. A positive divergence occurs when an indicator is pointing toward more bullish price action while prices continue to decline. For example, in February and into March, the RSI of the S&P 500 made a higher low in early March relative to early February while the S&P 500 itself was steadily making lower lows. This divergence was resolved when the S&P 500 exploded to the upside in mid-March.
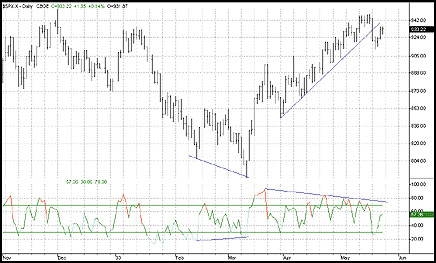
FIGURE 1: The RELATIVE STRENGTH INDEX AND THE S&P 500. Presented here are two instances of indicator/price divergences: a positive divergence in February/March and a negative divergence from mid-March into late May.
An example of a negative divergence appears in the RSI from mid-March to mid-May. At this time, the S&P 500 was making strongly higher highs, and bullishness returned to the market with a vengeance. However, the RSI continued to make lower and lower highs. While the resolution of this divergence remains to be seen (as of this writing), the lower highs in the RSI suggest that the S&P 500 could be in store for a significant correction in early summer.
Formula for RSI:
![]()
![]()
Learn more about the relative strength index:
Achelis, Steven B. [1995]. Technical Analysis From A To Z, Probus
Publishing.
Altman, Roger [1993]. "Relative Momentum Index: Modifying RSI,"
Technical Analysis of STOCKS & COMMODITIES, Volume 11: October.
Cartwright, David [1991]. "RSI As An Exit Tool," Technical
Analysis of STOCKS & COMMODITIES, Volume 9: April.
Ehlers, John F. [2002]. "The RSI Smoothed," Technical Analysis
of STOCKS & COMMODITIES, Volume 20: October.
Hall, Herbert S. [1991]. "The Common (But Useful) RSI," Technical
Analysis of STOCKS & COMMODITIES, Volume 9: August.
Knaggs, John [1993]. "Pattern Recognition, Price, And The RSI,"
Technical Analysis of STOCKS & COMMODITIES, Volume 11: August.
Quong, Gene, and Avrum Soudack [1989]. "Volume-Weighted RSI: Money
Flow," Technical Analysis of STOCKS & COMMODITIES, Volume
7: March.
Siligardos, Giorgos [2003]. "Reverse Engineering RSI," Technical
Analysis of STOCKS & COMMODITIES, Volume 21: June.
Star, Barbara [1993]. "RSI Variations," Technical Analysis
of STOCKS & COMMODITIES, Volume 11: July.
Wilder, J. Welles [1978]. New Concepts In Technical Trading Systems,
Trend Research.
Originally published in the July 2003 issue of Technical Analysis of STOCKS & COMMODITIES magazine. All rights reserved. © Copyright 2003, Technical Analysis, Inc.