July 2003
TRADERS' TIPS
You can copy these formulas and programs for easy use in your spreadsheet or analysis software. Simply "select" the desired text by highlighting as you would in any word processing program, then use your standard key command for copy or choose "copy" from the browser menu. The copied text can then be "pasted" into any open spreadsheet or other software by selecting an insertion point and executing a paste command. By toggling back and forth between an application window and the open Web page, data can be transferred with ease.
This month's tips include formulas and programs for:
TRADESTATION: REGULARIZATION
or return to July 2003 Contents
![]() TRADESTATION:
REGULARIZATION
TRADESTATION:
REGULARIZATION
In his article in this issue, titled "Regularization," Chris Satchwell describes a regularized exponential moving average. Here is the EasyLanguage code for this filter:
RegEMA: Indicator
inputs:
 EMA_Length( 9 ),
 Lambda( 9 ) ;
variables:
 RegEMA( 0 ),
 Alpha( 2 / ( EMA_Length + 1 ) ) ;
if CurrentBar > 3 then
 RegEMA  = (RegEMA[1]*(1+2*Lambda) + Alpha * (C-RegEMA[1])
           - Lambda * RegEMA[2])/(1+lambda)
else
 RegEMA = Close ;
Plot1( RegEMA, "RegEMA") ;
Figure 1 shows three regularized exponential moving averages (EMA)
compared with the standard EMA. Note that when lambda is set to zero, the
regularized EMA becomes identical to the standard EMA. In this chart, the
thick red line is the normal EMA, while the thin white line down its middle
is the regularized EMA with lambda set to zero. The other two regularized
EMAs have lambdas of 4 and 9, respectively.
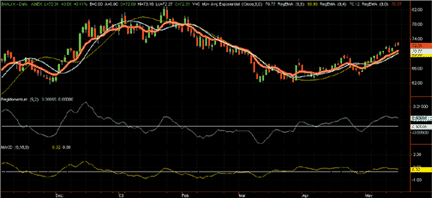
FIGURE 1: TRADESTATION, REGULARIZATION. Here's a sample TradeStation chart demonstrating the regularized exponential moving average.
Below the price chart is a comparison of the MACD to a regularized
momentum indicator. The code for the regularized momentum indicator is:
RegMomentum: Indicator
inputs:
 EMA_Length( 9 ),
 Lambda( 9 ) ;
variables:
 RegEMA( 0 ),
 Alpha( 2 / ( EMA_Length + 1 ) ) ;
if CurrentBar > 3 then
 RegEMA  = (RegEMA[1]*(1+2*Lambda) + Alpha * (C-RegEMA[1])
           - Lambda * RegEMA[2])/(1+lambda)
else
 RegEMA = Close ;
Plot1( (RegEMA - RegEMA[1]) / RegEMA, "RegMom") ;
Plot2( 0 ) ;
This strategy code will be available for download from the
EasyLanguage Exchange at www.tradestationworld.com. Look for the file "Regularized.eld."
--Mark Mills
MarkM@TSSEC at www.TradeStationWorld.com
EasyLanguage Questions Forums
TradeStation Securities, Inc.
A subsidiary of TradeStation Group, Inc.
![]() TRADESTATION:
THRUST OSCILLATOR
TRADESTATION:
THRUST OSCILLATOR
David Hawkins' article in this issue, "Find Those Market Tops," demonstrates the use of a thrust oscillator. Here is the EasyLanguage code for the thrust oscillator:
Thrust Oscillator: indicator
inputs:
 Length( 22 ) ;
variables:
 AI( 0 ),
 AV( 0 ),
 DI( 0 ),
 DV( 0 ),
 ThrustOsc( 0 ),
 AvgThrustOsc( 0 ) ;
AI = Close data2 ; {$ADV}
AV = Close data3 ; {$UVOL}
DI = Close data4 ; {$DECL}
DV = Close data5 ; {$DVOL}
ThrustOsc = (AI*AV - DI*DV)/(AI*AV + DI*DV) ;
AvgThrustOsc = XAverage(ThrustOsc, Length) ;
if CurrentBar > Length * 3 then
 Plot1(AvgThrustOsc);
This indicator code will be available for download from the EasyLanguage
Exchange on www.tradestationworld.com. Look for the file "Thrust.eld."
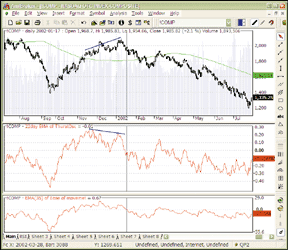
A sample chart is in Figure 2.
FIGURE 2: TRADESTATION, THRUST OSCILLATOR. Here's a sample TradeStation chart of the thrust oscillator.
--Mark Mills
MarkM@TSSec at www.TradeStationWorld.com
EasyLanguage Questions Forum
TradeStation Securities, Inc.
A subsidiary of TradeStation Group, Inc.
![]() TRADESTATION:
FRACTAL DIMENSION INDEX
TRADESTATION:
FRACTAL DIMENSION INDEX
The EasyLanguage code presented here is based on "Making Sense Of Fractals" by Erik Long, which appeared in the May 2003 issue of STOCKS & COMMODITIES.
Here is the code for finding the fractal dimension in TradeStation:
Fractal Dimension: Indicator
{ ************ Program to Calculate Fractal Dimension of Waveforms
Based on code by Carlos Sevcik,
"A procedure to estimate the fractal dimension of waveforms,"
see https://www.csu.edu.au/ci/vol05/sevcik/sevcik.html
Thanks for Alex Matulich for points out this article
https://unicorn.us.com/ }
Inputs:
 N ( 30 ) ;
variables:
  Diff( 0 ),
 Length( 0 ),
 PriceMax ( 0 ),
  PriceMin( 0 ),
    PriorDiff( 0 ),
    Iteration( 0 ),
    FractalDim( 0 ) ;
PriceMax = Highest( Close , N ) ;
PriceMin = Lowest( Close, N ) ;
Length = 0 ;
PriorDiff = 0 ;
for Iteration = 1 TO N -1
 begin
 if (PriceMax - PriceMin) > 0 then
  begin
  Diff = (Close[i] - PriceMin) / (PriceMax - PriceMin) ;
  if (Iteration> 1) then
   begin
   Length = Length + SquareRoot( Square(Diff - PriorDiff) + (1 / Square(N)) ) ;
   end ;
  PriorDiff = Diff  ;
  end ;
 end ;
if Length > 0 then
 FractalDim = 1 + ( LOG( Length )+ LOG( 2 ) ) / LOG( 2 * ( N ) )
else
 FractalDim = 0 ;
Plot1( FractalDim ) ;
This code will be available for download from the EasyLanguage Exchange
on www.tradestationworld.com. Look for the file "Fractal.eld."
A sample chart is in Figure 3.
FIGURE 3: TRADESTATION, FRACTAL DIMENSION. Here's a sample TradeStation chart of the fractal dimension index.
--Mark Mills
MarkM@TSSec at www.TradeStationWorld.com
EasyLanguage Questions Forum
TradeStation Securities, Inc.
A subsidiary of TradeStation Group, Inc.
![]() TRADESTATION:
TIME AND MONEY
TRADESTATION:
TIME AND MONEY
The EasyLanguage code presented here reproduces the time and money charts described in Stuart Belknap's May 2003 article in STOCKS & COMMODITIES.
The time and money chart displays a simple moving average and six volatility bands around price, as defined in the article. Since TradeStation can show a maximum of four plots in a single indicator, we broke the code into two pieces: a ChanLinesHi indicator and a ChanLinesLo indicator.
Also displayed is the code for Belknap's volatility index as
discussed in the article, and finally, the stochastic momentum indicator.
{ "T&M - Volatility Indicator"
from "Time and Money Charts" by Stuart Belknap }
inputs:   Period( 25 ) ;
variables:
yom( 0 ),
avyom( 0 ),
 varyyom( 0 ),
 som( 0 ),
 sigom( 0 ),
 HalfPeriod( 0 ) ;
HalfPeriod = Period /2 ;
yom = 100 * (Close - Average( Close, Period ) /
 Average( Close, Period ) );
avyom = Average( yom, 50 ) ;
varyyom = Average( yom*yom, 50 ) - ( avyom*avyom ) ;
som = squareroot( varyyom[ -HalfPeriod ] ) ;
sigom = Average( som, Period ) ;
plot1( sigom, "som" ) ;
~~~~~~~~~~~~~~~~~~~~~~
{ "T&M ? Stochastic Momentum Indicator"
from "Time and Money Charts" by Stuart Belknap }
inputs:
 Length( 12),
 Smooth1( 25 ),
 Smooth2( 2 ) ;
value1 = 100 * ( XAverage( XAverage( Close - (.5 *
 ( Highest( High, Length ) + Lowest( Low, Length ) ) ),
 Smooth1), Smooth2) /
 (.5 * XAverage( XAverage( Highest( High, Length )-
 Lowest( Low, Length ), Smooth1 ), Smooth2 ) ) ) ;
plot1( value1, "StochMom") ;
plot2( Average( value1, Smooth1 ), "SM Avg" ) ;
plot3( 50, "+50" ) ;
plot4( -50, "-50" ) ;
~~~~~~~~~~~~~~~~~~~~~
{ "T&M - ChanLinesHi Indicator"
from "Time and Money Charts" by Stuart Belknap }
Plots the minor term average and the three upper
channel lines }
inputs: Period( 25 ) ;
variables:
 Arm( 0 ),
 Level1( 0 ),
 Level2( 0 ),
 Level3( 0 ) ;
Arm = Average( C, Period ) ;
Level1 = (1 + (1.0 * 5/100 ) ) * Arm ;
Level2 = (1 + (2.0 * 5/100 ) ) * Arm ;
Level3 = (1 + (3.0 * 5/100 ) ) * Arm ;
plot1( Level1, "+L1" ) ;
plot2( Level2, "+L2" ) ;
plot3( Level3, "+L3" ) ;
plot4( Arm, "Arm" ) ;
~~~~~~~~~~~~~~~~~~~~~~~
{ "T&M - ChanLinesLo" Indicator"
from "Time and Money Charts" by Stuart Belknap }
Plots the minor term average and the three lower
channel lines }
inputs: Period( 25 ) ;
variables:
 Arm( 0 ),
 Level1( 0 ),
 Level2( 0 ),
 Level3( 0 ) ;
Arm = Average( C, Period ) ;
Level1 = (1 - (1.0 * 5/100 ) ) * Arm ;
Level2 = (1 - (2.0 * 5/100 ) ) * Arm ;
Level3 = (1 - (3.0 * 5/100 ) ) * Arm ;
plot1( Level1, "-L1" ) ;
plot2( Level2, "-L2" ) ;
plot3( Level3, "-L3" ) ;
plot4( Arm, " Arm " ) ;
The code will also be available for download from the EasyLanguage
Exchange on TradestationWorld.com at https://www.tradestationworld.com/discussions/default.asp?Group=8.
Look for the file "TimeAndMoney.eld". A sample chart is shown
in Figure 4.
FIGURE 4: TRADESTATION, TIME AND MONEY. Here's a sample time and money chart in TradeStation.
--Ian MacAuslan
EasyLanguage Specialist
TradeStation Securities, Inc.
A subsidiary of TradeStation Group, Inc.
www.TradeStationWorld.com
![]() METASTOCK:
REGULARIZATION
METASTOCK:
REGULARIZATION
Chris Satchwell's article in this issue, "Regularization," includes the calculation method for two indicators: a regularized exponential moving average and a regularized momentum. The MetaStock formulas presented here prompt for the number of periods in the moving average and for the regularization constant. Since the article did not include a range for the regularization constant, the formulas allow for any values between zero and 20.
To create a formula in MetaStock, select Indicator Builder from the
Tools menu. Click New and then enter the formula shown below. When finished,
click OK. Repeat for the second formula.
GO BACKName: Regularized EMA Formula: x:=Input("number of periods in moving average",1,500,21); d:=Input("regularization constant",0,20,.5); a:=2/(x+1); (PREV*(1+(2*d))+(a*(C-PREV))-(d*Ref(PREV,-1)))/(1+d) Name: Regularized Momentum Formula: x:=Input("number of periods in moving average",1,500,21); d:=Input("regularization constant",0,20,.5); a:=2/(x+1); f:=(PREV*(1+(2*d))+(a*(C-PREV))-(d*Ref(PREV,-1)))/(1+d); (f-Ref(f,-1))/f
--William Golson
Equis International
www.equis.com
![]() METASTOCK:
THRUST OSCILLATOR
METASTOCK:
THRUST OSCILLATOR
David Hawkins' article in this issue describes the thrust oscillator. This formula requires the Security Data function, which is only available in MetaStock Professional and the 8.01 end-of-day version. This function allows you to directly reference the data from several different securities/ticker symbols. The formula below is written using ticker symbols from eSignal online data.
To create a new formula in MetaStock, select Indicator Builder from
the Tools menu. Click New and then enter the formula shown here. When finished,
click OK.
Name: Thrust Oscillator
Formula:
ai:= Security("ONLINE:$ADV",C);
ds:= Security("ONLINE:$DECL",C);
av:= Security("ONLINE:$UVOL",C);
dv:= Security("ONLINE:$DVOL",C);
((ai*av)-(ds*dv))/((ai*av)+(ds*dv))
If you are using Reuters Datalink instead, the formula would be:
Name: Thrust Oscillator
Formula:
ai:= Security("ONLINE:X.NYSE-A",C);
ds:= Security("ONLINE: X.NYSE-D",C);
av:= Security("ONLINE: X.NYSE-A",V);
dv:= Security("ONLINE: X.NYSE-D",V);
((ai*av)-(ds*dv))/((ai*av)+(ds*dv))
--William Golson
Equis International
www.equis.com
![]() AMIBROKER:
REGULARIZATION
AMIBROKER:
REGULARIZATION
In "Regularization" in this issue, Chris Satchwell presents a modified smoothing technique called regularization. The regularized EMA shown in the article is in fact a form of second-order infinite impulse response filter. Such filtering can easily be implemented using Afl native looping introduced in version 4.31.
In the formula presented in Listing 1, we wrap the entire regularized
EMA (REMA) code into a user-defined function, thus enabling the user to
use REMA as any of the Afl built-in functions. To demonstrate how to call
user-defined functions, we added plots of regularized momentum and MACD.
LISTING 1
/* Regularized EMA and momentum
**
** Note: AmiBroker 4.34 or higher required
*/
function REMA( array, alpha, lambda )
{
  // initialize first two elements by simple MA
  result[ 0 ] = array[ 0 ];
  result[ 1 ] = (array[ 0 ] + array[ 1 ])/2;
  Coeff0 = alpha/(1 + lambda);
  Coeff1 = (1 + 2 * lambda - alpha )/( 1 + lambda );
  Coeff2 = - lambda / ( 1 + lambda );
  for( i = 2; i < BarCount; i++ )
  {
   result[ i ] = Coeff0 * array[ i ] +
              Coeff1 * result[ i - 1 ] +
              Coeff2 * result[ i - 2 ];
  }
  return result;
}
re = REMA( Close, 0.05, 1.8 ); // calling user-defined REMA function
RegMom = ( re - Ref( re, -1 ) ) / re; // regularized momentum
Plot( RegMom, "Regularized momentum", colorGreen, styleThick );
Plot( MACD(12, 26 ), "MACD(12,26)", colorRed, styleOwnScale);
A downloadable version of this formula is available from AmiBroker's
website. A sample chart is shown in Figure 5.
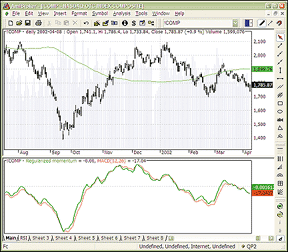
FIGURE 5: AMIBROKER, REGULARIZED MOMENTUM INDICATOR. This AmiBroker screenshot shows regularized momentum (0.05, 1.8) in green and standard MACD (12, 26) in red. Both give similar signals, but regularized momentum often provides an earlier signal.
FIGURE 6: AMIBROKER, THRUST OSCILLATOR. This AmiBroker screenshot shows a daily Nasdaq composite chart with a 22-day exponential moving average of the thrust oscillator and a 35-day ease of movement oscillator. Both oscillators signal the end of an intermediate-term up rally in the beginning of January 2002.
--Tomasz Janeczko, AmiBroker.com
www.amibroker.com
![]() AMIBROKER:
THRUST OSCILLATOR
AMIBROKER:
THRUST OSCILLATOR
In "Find Those Market Tops With The Thrust Oscillator" in this issue, author David Hawkins presents a technique that helps to find tops of failed intermediate-term rallies in a long-term bear market. The technique involves two indicators: the thrust oscillator (and its moving average) and the ease of movement oscillator. Both oscillators can be easily implemented in AmiBroker Formula Language (AFL).
Listing 1 shows the AFL code for a 22-day exponential moving average
of the thrust oscillator. Listing 2 shows the code for a 35-day exponentially
smoothed ease of movement oscillator.
LISTING 1
/*
** Get A/D data from vendor-specific special symbols
** in this example Quotes Plus
**
*/
AI = Foreign("!NQ-A","C");
AV = Foreign("!NQ-AV", "C");
DI = Foreign("!NQ-D", "C" );
DV = Foreign("!NQ-DV", "C" );
/*
** The above Foreign section used QP2 symbols,
** you may need to adjust them to your data vendor
** or use the following section
** and AmiBroker composite recalculation tool
AI = AdvIssues();
AV = AdvVolume();
DI = DecIssues();
DV = DecVolume();
**
*/
ThrustOsc = ( AI * AV - DI *DV )/( AI * AV + DI * DV );
Plot( EMA( ThrustOsc, 22 ), "22day EMA of ThurstOsc", colorRed );
LISTING 2
Midpoint = (H+L)/2;
MPM = Midpoint - Ref( Midpoint , -1);
BoxRatio = ( V/10000 )/( 8 * (H-L) );
EMV = Nz( MPM/BoxRatio );
Plot( EMA( EMV, 35 ), "Ease of movement (35)", colorRed );
A downloadable version of the formula is available from AmiBroker.com
website.
--Tomasz Janeczko, AmiBroker.com
www.amibroker.com
![]() AIQ
EXPERT DESIGN STUDIO: THRUST OSCILLATOR
AIQ
EXPERT DESIGN STUDIO: THRUST OSCILLATOR
Here is the code for the thrust oscillator and the ease of movement
indicator for use in AIQ's Expert Design Studio, based on "Find
Those Market Tops" by David Hawkins in this issue. A sample chart
is shown in Figure 7.
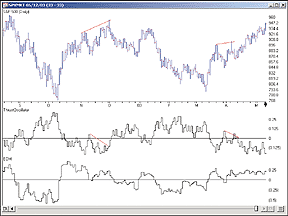
FIGURE 7: AIQ, THRUST OSCILLATOR. Here is a sample AIQ chart of the thrust oscillator (middle pane) and the ease of movement indicator (bottom pane).
!! July 2003 Stocks & Commodities.  "Find Those Market Tops" by David Hawkins.
!!  Thrust Oscillator and Arms' Ease of Movement
Thrust is ([Dec Issues] * [Dec Volume]) - ([Adv Issues] * [Adv Volume]).
OSC is Thrust / (([Dec Issues]*[Dec Volume]) + ([Adv Issues]*[Adv Volume])).
AvgOSC is expavg(Osc, 22).
CurrentPrice is ([high] + [low]) / 2.
PreviousPrice is (Val([high], 1) + Val([low], 1)) / 2.
CurrentVolume is ([volume] / 10000) / ([high] - [low]).
EMV is (CurrentPrice - PreviousPrice) / CurrentVolume.
EMVAvg is expavg(EMV, 25).
--Mike KadenGO BACK
Aiq Systems
www.aiq.com
![]() eSIGNAL:
THRUST OSCILLATOR
eSIGNAL:
THRUST OSCILLATOR
This eSignal formula is based on "The Thrust Oscillator: Find
Those Market Tops" by David Hawkins in this issue. A sample eSignal
chart is shown in Figure 8.
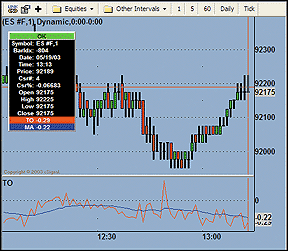
FIGURE 8: eSIGNAL, THRUST OSCILLATOR. This eSignal chart demonstrates the thrust oscillator.
/**********************************************************************
Description : This Indicator plots the THRUST OSCILLATOR
Provided By : TS Support, LLC for eSignal (c) Copyright 2003
**********************************************************************/
function preMain()
{
 setStudyTitle("TO");
 setCursorLabelName("TO",0);
 setCursorLabelName("MA",1);
 setDefaultBarFgColor(Color.red,0);
 setDefaultBarFgColor(Color.blue,1);
}
var EMA_1 = 0.0;
function main(Length)
{
 if (Length == null)
  Length = 22;
 var K = 2 / (Length + 1);
 var TO = 0;
 var EMA = 0;
 if( getValue("close","$ADV") * getValue("volume","$ADV")
 + getValue("close","$DECL") * getValue("volume","$DECL")
 != 0)
  TO = (getValue("close","$ADV") * getValue("volume","$ADV")
 - getValue("close","$DECL") * getValue("volume","$DECL"))
 / (getValue("close","$ADV") * getValue("volume","$ADV")
 + getValue("close","$DECL") * getValue("volume","$DECL"));
 EMA = K * TO  + (1 - K) * EMA_1;
 if (getBarState() == BARSTATE_NEWBAR)
  EMA_1 = EMA;
 return new Array(TO,EMA);
}
--eSignal, a division of Interactive Data Corp.
800 815-8256, www.esignal.com
![]() WEALTH-LAB:
REGULARIZATION
WEALTH-LAB:
REGULARIZATION
We created a custom indicator for Chris Satchwell's regularized EMA and named it "RegEma." This custom indicator can be used on the Wealth-Lab.com website by adding the statement {$I 'RegEMA'} to the top of your script. You can load the RegEMA indicator into Wealth-Lab Developer by selecting Community/Download ChartScripts from the main menu.
Alternatively, you can use the New Indicator Wizard in Wealth-Lab Developer
to create the indicator from scratch. When the New Indicator Wizard asks
you to provide a name for the indicator, specify "RegEMA."
Next, you are asked for a list of parameters. Add three parameters, one
named "Series" of type integer, followed by two float parameters
named "smoothing" and "regularization" (Figure
9). After you click Next, Wealth-Lab Developer creates the shell code for
the indicator. You need to provide the code that calculates the indicator's
value. Paste in the following code:
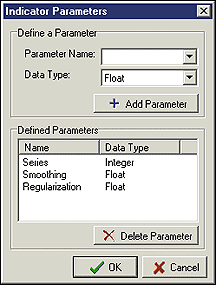
FIGURE 9: Wealth-Lab, ADDING PARAMETERS. Add three parameters, one named "Series," followed by two float parameters named "smoothing" and "regularization."
{ Calculate your indicator value here }
var Fn, Fn_1, Gn1, h, a, term1, term2, term3: float;
for Bar := 0 to 19 do
@Result[Bar] := PriceClose( Bar );
@Result[20] := SMA( Bar, #Close, 20 );
for Bar := 21 to BarCount() - 1 do
begin
Fn := @Result[Bar - 1];
Fn_1 := @Result[Bar - 2];
Gn1 := @Series[Bar];
h := Regularization;
a := Smoothing;
term1 := Fn + Fn * ( 2 * h );
term2 := a * Gn1 - a * Fn;
term3 := h * Fn_1;
@Result[Bar] := ( term1 + term2 - term3 ) / (
1 + h );
end;
Once the indicator is installed, you can use it in any trading
system. We coded a very simple system that goes long when a shorter-term
RegEMA crosses over a longer-term RegEMA. RegEMA is a smoothed indicator,
so it is not subject to as many whipsaw signals as some other moving averages.
Figure 10 displays a sample crossover trade in cotton futures.
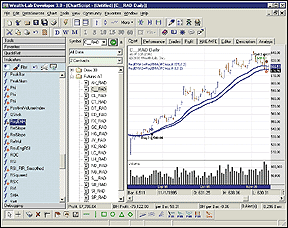
FIGURE 10: Wealth-Lab, REGULARIZED EMA. This sample Wealth-Lab chart displays a sample crossover trade in cotton futures based on a simple system that goes long when a shorter-term RegEMA crosses over a longer-term RegEMA. RegEMA is a smoothed indicator, so it is not subject to as many whipsaw signals as some other moving averages.
{$I 'RegEMA'}
var RegEMA1, RegEMA2: integer;
RegEMA1 := RegEMASeries( #Close,0.075,0.2 );
PlotSeries( RegEMA1, 0, 005, #Thick );
RegEMA2 := RegEMASeries( #Close,0.1,0.2 );
PlotSeries( RegEMA2, 0, 009, #Thick );
var Bar: integer;
for Bar := 20 to BarCount - 1 do
begin
if not LastPositionActive then
{ Entry Rules }
begin
if CrossOver( Bar, RegEMA2, RegEMA1 ) then
BuyAtMarket( Bar + 1, ''
);
end
else
{ Exit Rules }
begin
if TurnDown( Bar, RegEMA2 ) then
SellAtMarket( Bar + 1, LastPosition,
'' );
end;
end;
--Dion Kurczek, Wealth-Lab, Inc.
www.wealth-lab.com
![]() WEALTH-LAB:
THRUST OSCILLATOR
WEALTH-LAB:
THRUST OSCILLATOR
In "Find Those Market Tops" in this issue, author David Hawkins makes use of the thrust oscillator (TO). You can use our Index-Lab add-in for Wealth-Lab Developer to create the components of the thrust oscillator as well as many other breadth indicators. You can form your own breadth indicators based on your own custom lists of stocks or futures, giving you more freedom than relying on the limited number of published breadth indicators for the broad averages.
The first step is to create four new components in Index-Lab, one for
advancing issues (AI), declining issues (DI), advancing volume (AV), and
declining volume (DV). The following scripts show you exactly how these
are defined, and the Index-Lab settings for one of the components can be
seen in Figure 11.
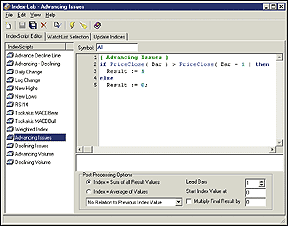
FIGURE 11: Wealth-Lab, THRUST OSCILLATOR SETTINGS. This shows the Index-Lab settings for AI (advancing issues).
{ Advancing Issues }
if PriceClose( Bar ) >  PriceClose( Bar - 1 ) then
  Result := 1
else
  Result :=  0;   { Declining Issues }
if PriceClose( Bar ) <  PriceClose( Bar - 1 ) then
  Result := 1
else
  Result :=  0;   { Advancing Volume }
if PriceClose( Bar ) >  PriceClose( Bar - 1 ) then
  Result := Volume( Bar )
else
   Result := 0;   { Declining Volume }
if PriceClose( Bar ) <  PriceClose( Bar - 1 ) then
  Result := Volume( Bar )
else
   Result := 0;
Once you have these breadth indicators created, you can use them
in any Wealth-Lab Developer trading system. The following script recreates
the thrust oscillator. It displays the TO in its raw form, smoothed by
a 22-bar exponential moving average (EMA). See Figure 12.
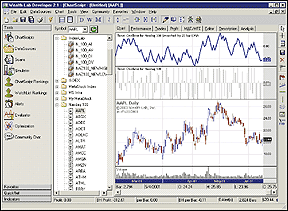
FIGURE 12: Wealth-Lab, THRUST OSCILLATOR. This sample Wealth-Lab chart plots the thrust oscillator smoothed by a 22-bar exponential moving average (Ema).
var AI, AV, DI, DV,
THRUSTOSC, TPANE, SMOOTHED,  SPANE: integer;
AI := GetExternalSeries( 'N_100_AI', #Close );
AV :=  GetExternalSeries( 'N_100_AV', #Close );
DI := GetExternalSeries( 'N_100_DI',  #Close );
DV := GetExternalSeries( 'N_100_DV', #Close );   ThrustOsc := DivideSeries(
SubtractSeries(  MultiplySeries( AI, AV ),
  MultiplySeries( DI, DV ) ), ( AddSeries(  MultiplySeries( AI, AV ),
  MultiplySeries( DI, DV ) ) ) );
TPane :=  CreatePane( 100, true, true );
PlotSeries( ThrustOsc, TPane, #Gray,  #Histogram );
DrawLabel( 'Thrust Oscillator for Nasdaq 100', TPane  );   Smoothed :=
EMASeries( ThrustOsc, 22 );
SPane  := CreatePane( 100, true, true );
PlotSeries( Smoothed, SPane, #Blue, #Thick  );
DrawLabel( 'Thrust Oscillator for Nasdaq 100 Smoothed by 22 bar EMA',
SPane );
--Dion Kurczek, Wealth-Lab, Inc.
www.wealth-lab.com
![]() NEUROSHELL
TRADER: REGULARIZATION
NEUROSHELL
TRADER: REGULARIZATION
Chris Satchwell's regularization indicators described in this
issue may be created by using NeuroShell Trader's ability to call
external programs. The programs may be written in C, C++, Power Basic
(also Visual Basic using one of our add-on packages), and Delphi. We've
created the regularization indicators that you can download from the NeuroShell
Trader free technical support website (Figure 13).
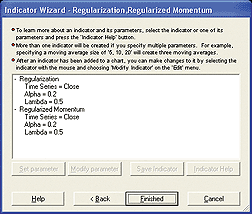
FIGURE 13: NEUROSHELL TRADER, REGULARIZATION. Use NeuroShell Trader's Indicator Wizard to add the regularization and regularized momentum indicators.
After downloading the custom indicators, you can insert them by
doing the following:
1. Select "New Indicator..." from the Insert menu.
2. Select the Custom Indicator category.
3. Select the regularization and regularized momentum indicators.
4. Select the alpha and lambda values you desire.
A sample chart is shown in Figure 14.
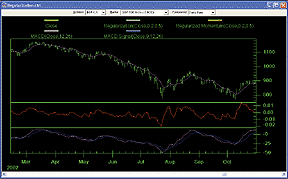
FIGURE 14: NEUROSHELL TRADER, REGULARIZATION. This sample NeuroShell Trader chart displays the regularization, regularized momentum, MACD, and MACD signal indicators.You have the option of combining these indicators with any of our 800+ built-in indicators into a chart, prediction, or trading strategy. In addition, if you decide to use these indicators in a prediction or a trading strategy, the coefficients may be optimized by the Genetic Algorithm built into NeuroShell Trader Professional and DayTrader Professional. This process will produce custom versions of the regularization indicators that best fit your data.
Users of NeuroShell Trader can go to the STOCKS & COMMODITIES section of the NeuroShell Trader free technical support website to download a copy of any Traders' Tips.
For more information on NeuroShell Trader, visit www.NeuroShell.com.
--Marge Sherald, Ward Systems Group, Inc.
301 662-7950, sales@wardsystems.com
www.neuroshell.com
![]() NEUROSHELL
TRADER: THRUST OSCILLATOR
NEUROSHELL
TRADER: THRUST OSCILLATOR
To implement David Hawkins' thrust oscillator and confirming
trend indicators in NeuroShell Trader, select "New Indicator ..."
from the Insert menu and use the Indicator Wizard to create each of the
following indicators:
Thrust oscillator:
Divide( Subtract ( Mult (AI,AV), Mult(DI,DV) ), Add2 ( Mult (AI,AV), Mult(DI,DV) ) )
22-day EMA of thrust oscillator:
ExpMovAvg ( THRUST OSCILLATOR, 22 )
35-day EMA of Arm's ease of movement:
ExpMovAvg ( ArmsEaseMovement ( High, Low, Volume, 5 ), 35 )
50 day EMA:
ExpMovAvg ( Close, 50 )
Users of NeuroShell Trader can go to the STOCKS & COMMODITIES
section of the NeuroShell Trader free technical support website to download
a sample chart that includes the thrust oscillator and confirming trend
indicators.
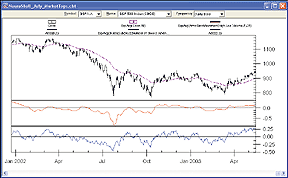
FIGURE 15: NEUROSHELL TRADER, THRUST OSCILLATOR. Here's a sample NeuroShell Trader chart demonstrating the thrust oscillator and confirming trend indicators.
--Marge Sherald, Ward Systems Group, Inc.GO BACK
301 662-7950, sales@wardsystems.com
www.neuroshell.com
![]() NEOTICKER:
REGULARIZATION
NEOTICKER:
REGULARIZATION
The regularized exponential moving average presented in "Regularization" in this issue by Chris Satchwell can be constructed in NeoTicker using either Delphi Script or VBScript. To construct the indicator "Regularization EMA," first create a new indicator. Name this indicator "regema." Then add an integer parameter "Period" and a real parameter "Regularization constant" to the indicator. After the indicator setup is completed, you can enter the body of the code (Listing 1) written in Delphi Script:
LISTING 1
function regema : double;
var factor, lambda : double;
begin
   if not data1.valid [0] then
   begin
      itself.success := false;
      exit;
   end;
   // Smoothing constant for exponenetial moving
   factor := 1/param1.int;
   lambda := param2.real;
   if heap.size = 0 then
   begin
      heap.allocate (3);
      heap.value [0] := 1;
      heap.value [1] := data1.value [0];
      itself.success := false;
      exit;
   end;
   if heap.value [0] < 2 then
   begin
      heap.value [2] := data1.value [0];
      itself.success := false;
   end
   else if (heap.value [0] > 0) then
   begin
      result := (heap.value [1]*(1+2*lambda) +
              factor*(Data1.Value [0]-heap.value [1]) -
              lambda*heap.value [2])/(1+lambda);
      heap.value [2] := heap.value [1];
      heap.value [1] := result;
   end;
   heap.inc (0);
end;
The regema will plot a single line showing the values of the
regularized exponential moving averages (Figure 16).
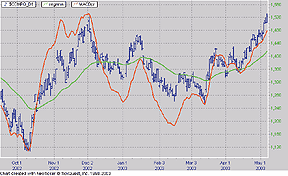
FIGURE 16: NEOTICKER, REGULARIZATION. The regularized EMA (regema) indicator will plot a single line showing the values of the regularized exponential moving averages.
A downloadable version of this indicator is available from
the Yahoo! NeoTicker user group file area at https://groups.yahoo.com/group/neoticker/.
--Kenneth Yuen, TickQuest Inc.
www.tickquest.com
![]() NEOTICKER:
THRUST OSCILLATOR
NEOTICKER:
THRUST OSCILLATOR
To implement in NeoTicker the concept presented in "The Thrust Oscillator: Find Those Market Tops" by David Hawkins in this issue, first load the daily data of Nasdaq composite into the chart, then load the daily Nasdaq advance issues, daily Nasdaq advance volume, daily Nasdaq decline issues, and daily Nasdaq decline volume into the chart. All four of the advance decline data series should be made invisible. After all data is loaded, construct a formula indicator with four links (that is, four data series). Then enter the following lines of code (Listing 1):
LISTING 1
myTO := (data1 * data2 - data3*data4) / (data1 * data2 + data3 * data4);
plot1 := qc_xaverage (myTO, param1);
Add the indicator to the chart with the advance issues data as the
first link, advance volume data as the second link, decline issues data
as the third link, and decline volume data as the fourth link. Then add
the ease of movement and add the exponential moving average on the ease
of movement to replicate the chart from the article (Figure 17).
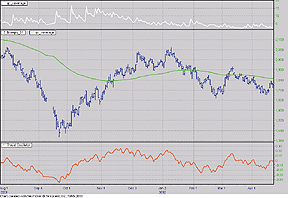
FIGURE 17: NEOTICKER, THRUST OSCILLATOR. This sample NeoTicker chart shows the thrust oscillator, the ease of movement, and the exponential moving average on the ease of movement to replicate the chart from Hawkins' article.
--Kenneth Yuen, TickQuest Inc.GO BACK
www.tickquest.com
![]() TRADINGSOLUTIONS:
REGULARIZATION
TRADINGSOLUTIONS:
REGULARIZATION
In his article "Regularization" in this issue, Chris Satchwell presents an example of regularization for a regularized exponential moving average (Ema).
This formula can be implemented in TradingSolutions using the following function:
Name: Regularized EMA
Short Name: REMA
Inputs: Function Value, Smoothing Constant, Regularization Constant
Formula:
If (IsNull (Lag (Function Value,2)),Function Value,Div (Sub (Add
 (Mult (Prev (1),Add (1,Mult (2,Regularization Constant))),Mult
 (Smoothing Constant,Sub (Function Value,Prev (1)))),Mult
 (Regularization Constant,Prev (2))),Add (1,Regularization
 Constant)))
This function is available in a file that can be downloaded from
the TradingSolutions website in the Solution Library section.
As with many indicators, functions such as the regularized EMA can make good inputs to neural network predictions. If used directly, you will want to set the preprocessing to "percent change," since the value is similar to the price in that it is not bounded. Alternatively, a percent difference between the price and this value could be used as an input.
--Gary Geniesse, NeuroDimension, Inc.
www.tradingsolutions.com
![]() ASPEN
GRAPHICS: THRUST OSCILLATOR
ASPEN
GRAPHICS: THRUST OSCILLATOR
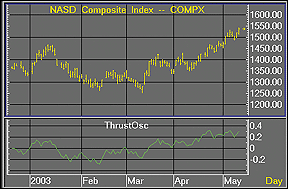
Here's the code for Aspen Graphics based on the article "The Thrust Oscillator: Find Those Market Tops" in this issue by David Hawkins.
The ThrustOsc study was written to be used with the Dow Jones Industrial or the Nasdaq composite indices. The ThrustOsc2 study can be used with the S&P 500 index, since a different calculation is needed to display the thrust oscillator with the S&P 500.
The formula for the thrust oscillator is: ((Nyse Issues Up x Nyse Up Volume) - (Nyse Issues Down * Nyse down volume)) / ((Nyse Issues Up x Nyse Up Volume) + (Nyse Issues Down x Nyse down volume)). Then a 21-period exponential moving average is applied to help smooth out the study. The code is:
ThrustOsc(series)=(("@ISN_UP"*"@VSN_UP")-("@ISN_DN"*"@VSN_DN"))/(("@ISN_UP"*"@VS
N_UP")+("@ISN_DN"*"@VSN_DN"))
FIGURE 18: ASPEN GRAPHICS, THRUST OSCILLATOR ON DJIA. This Apsen Graphics chart shows the thrust oscillator on Dow Jones Industrial Average data.
The formula for the ThrustOsc2 is: ((Nyse Issues Up x Nyse Up Volume)
- (Nyse Issues Down * Nyse Down Volume)) / ((Nyse Issues Up x Nyse Up Volume)
+ (Nyse Issues Down x Nyse Down Volume)) + ((Nasq Issues Up x Nasq Up Volume)
- (Nasq Issues Down * Nasq Down Volume)) / ((Nasq Issues Up x Nasq Up Volume)
+ (Nasq Issues Down x Nasq Down Volume)). Once again, a 21-period exponential
moving average is applied to smooth out the study. Here is the equivalent
code:
ThrustOsc2(series)=(("@ISN_UP"*"@VSN_UP")-("@ISN_DN"*"@VSN_DN"))/(("@ISN_UP"*"@V
SN_UP")+("@ISN_DN"*"@VSN_DN"))+(("@ISZ_UP"*"@VSZ_UP")-("@ISZ_DN"*"@VSZ_DN"))/(("
@ISZ_UP"*"@VSZ_UP")+("@ISZ_DN"*"@VSZ_DN"))
These studies were written to work with the DTN datafeed. Studies
can be made available for the Reuters feed upon request.
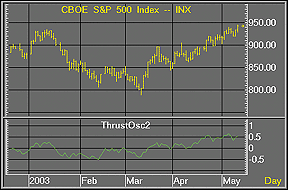
FIGURE 19: ASPEN GRAPHICS, THRUST OSCILLATOR ON S&P 500. This Aspen Graphics chart shows the thrust oscillator on S&P 500 data.
--Andy Sewell
Aspen Graphics Technical Support
asewell@aspenres.com
www. aspenres.com
![]() INVESTOR/RT:
THRUST OSCILLATOR
INVESTOR/RT:
THRUST OSCILLATOR
The thrust oscillator described by David Hawkins in this month's article, "Find Those Market Tops With The Thrust Oscillator," can be recreated in Investor/RT using a custom indicator.
Figure 20 has four panes. The top pane shows a daily candlestick chart
of the Nasdaq composite index (ending 5/19/03). The second pane gives a
representation of the advancing versus the declining issues for the Nasdaq
composite. This is done using the new "price band" indicator.
The price band indicator allows the user to draw historical bands between
any two lines, where each line represents any custom indicator. In this
case, one custom indicator simply represents the advancing issues (syntax:
"CL($Advq)") while the other custom indicator represents
the declining issues (syntax: "CL($Declq)"). The third pane
also shows a price band indicator, except this one represents the advancing
volume ("CL($Uvolq)") and declining volume ("CL($Dvolq)").
In both panes, the bands are drawn in green when the advances are greater
than the declines.
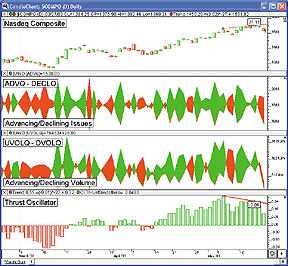
FIGURE 20: Investor/RT, THRUST OSCILLATOR. The top pane shows a candlestick chart of the NASDAQ composite index. The second pane down shows the advancing and declining issues (green when advances outnumber declines). The third pane shows the advancing and declining volume. The bottom pane shows the thrust oscillator.
In the bottom pane, the thrust oscillator is charted. This is a
22-day exponential moving average of the thrust oscillator. The thrust
oscillator can be coded in Investor/RT RTL(Real-Time Language) using a
custom indicator with the following syntax:
(CL($ADVQ) * CL($UVOLQ) - CL($DECLQ) * CL($DVOLQ)) /
(CL($ADVQ) * CL($UVOLQ) + CL($DECLQ) * CL($DVOLQ))
Investor/RT supports a variety of data services including eSignal,
Signal, myTrack, DTN.IQ, Quote.com, DTN, and Dial/Data. The ticker symbols
seen in this syntax above are the ticker symbols transmitted by eSignal
and represent the following:
$ADVQ - Number of advancing issues
$UVOLQ - Volume of advancing issues
$DECLQ - Number of declining issues
$DVOLQ - Volume of declining issues
Those using other data services will need to look up the proper
ticker symbols for their respective data services. In Rtl, an expression
such as "CL($Advq)" simply pulls the closing prices from
the ticker symbol "$Advq."
In order to form the exponential moving average of this thrust oscillator, another custom indicator must be used with the following syntax:
MA(CI)
where CI represents the thrust custom indicator that was created
above, and MA is set up as a 22-period exponential smoothing (the "price"
of MA is not relevant in this case, as CI will be substituted as the price).
This smoothed thrust oscillator custom indicator is charted as a histogram
in the bottom pane of Figure 20. Notice from the trendlines that are drawn
in the top and bottom panes that the Nasdaq composite prices and the smoothed
thrust oscillator have diverged over the recent period (5/06/03 to 5/15/03).
While the Nasdaq highs rose by 21.16, the thrust oscillator dropped 0.06
over the same period. According to the Hawkins article, this would indicate
a bearish diversion.
For more on creating custom indicators in Investor/RT, see https://www.linnsoft.com/tour/customIndicator.htm. For more on creating the price bands indicator, see https://www.linnsoft.com/tour/techind/bands.htm.
--Chad Payne, Linn Software
800-546-6842, info@linnsoft.com
www.linnsoft.com
![]() STOCKWIZ:
REGULARIZATION
STOCKWIZ:
REGULARIZATION
Here is the StockWiz formula for the regularized momentum indicator
discussed in "Regularization" by Chris Satchwell in this
issue.
###################################################################
#
#
#   NAME
#   Regularized Momentum (with EMA)
#
#   This StockWiz SAL formula generates a graph of the Regularized Momentum of an Exponential Moving Average.
#
#   The User Variable ma_days defines the length of the Moving Average.
#
#   The Chart displayed is 'Intelligent' and changes Indicator Lengths, Titles and Graph Labels based on User Inputs.
#
#   RESULTS
#   Regularized Momentum Indicator (and the MACD), with OHLC Price and Volume
#
###################################################################
(GCLEAR)
(SOURCE "WORKSHEET")
#-------------------- Setup the Graph --------------------
%SETUP
(SET indicator_name "Regularized Momentum [green] and MACD [red]")
(ADJUST "ADJUST_FOR_SPLITS_AND_INTERPOLATE")
(GOTO %SKIP (GSPLIT))
(ADJUST "RAW_DATA")
%SKIP (NA)
(SET DAYS (GDAYS))     # Read "Last n days" field from the graph menu
(SUBSETS 9)            # Number of lines to be displayed
(SET ma_days 30)
#-------------------- Label the Graph --------------------
(SET name (GETSTRING "NAME"))
(SET ttl name)
(SAPPEND ttl " [")
(SAPPEND ttl (CURRENT))
(SAPPEND ttl "] - ")
(SET lastCLOSE (LAST (GETVECTOR (CURRENT) "CLOSE")))
(SAPPEND ttl (DOUBL2STR lastCLOSE "%.03f"))
(TITLE ttl)
(SET subttl "Bar Graph with ")
(SAPPEND subttl (DOUBL2STR ma_days "%.0lf"))
(SAPPEND subttl " day EMA, ")
(SAPPEND subttl indicator_name)
(SAPPEND subttl ", Volume")
(SUBTITLE subttl)
#-------------- Built the Vectors and the Graph --------------
# Get the vectors to be plotted from the Company Selected in the database
(SET OPEN   (GETVECTOR (CURRENT) "OPEN"))
(SET HIGH   (GETVECTOR (CURRENT) "HIGH"))
(SET LOW    (GETVECTOR (CURRENT) "LOW"))
(SET CLOSE  (GETVECTOR (CURRENT) "CLOSE"))
(SET VOLUME (GETVECTOR (CURRENT) "VOLUME"))
# Exponential percentage for EMA, that corresponds to 30 days
(SET A (DIV 2 (ADD 30 1)))
# Lamda constant
(SET L 0.4)
(SET SMA (MOVAVG CLOSE 30))
# Exponential moving average of the close price
(SET EMA (EMOVAVG2 CLOSE A))
(SET P1 (VSMUL EMA (ADD 1 (MUL 2 L))))
(SET P2 (VSMUL (VSUB CLOSE EMA) A))
(SET P3 (VSMUL SMA L))
(SET P4 (ADD 1 L))
(SET A1 (VADD P1 P2))
(SET A2 (VSUB A1 P3))
# Regularized EMA-1
(SET RMA_1 (VSDIV A2 P4))
(SET RM1 (VSUB RMA_1 EMA))
# Regularized Momentum 1
(SET REG_MOM1 (VDIV RM1 RMA_1))
(SET P5 (VSMUL RMA_1 (ADD 1 (MUL 2 L))))
(SET P6 (VSMUL (VSUB CLOSE RMA_1) A))
(SET P7 (VSMUL EMA L))
(SET P8 (ADD 1 L))
(SET A3 (VADD P5 P6))
(SET A4 (VSUB A3 P7))
# Regularized EMA-2
(SET RMA_2 (VSDIV A4 P8))
(SET RM2 (VSUB RMA_2 RMA_1))
# Regularized Momentum 2
(SET REG_MOM2 (VDIV RM2 RMA_2))
(SET P9  (VSMUL RMA_2 (ADD 1 (MUL 2 L))))
(SET P10 (VSMUL (VSUB CLOSE RMA_2) A))
(SET P11 (VSMUL RMA_1 L))
(SET P12 (ADD 1 L))
(SET A5 (VADD P9 P10))
(SET A6 (VSUB A5 P11))
# Regularized EMA-3
(SET RMA_3 (VSDIV A6 P12))
(SET RM3 (VSUB RMA_3 RMA_2))
# Regularized Momentum 3
(SET REG_MOM3 (VDIV RM3 RMA_3))
# 12 day Exponential Moving Average
(SET ema1 (EMOVAVG CLOSE 12))
# 26 day Exponential Moving Average
(SET ema2 (EMOVAVG CLOSE 26))
# MACD Line
(SET MACD_Line (VSUB ema1 ema2))
(SET ZERO (VSMUL CLOSE 0))
# Define the graph to be plotted
(GRAPHSET 1 4 1 0.30 "LHOC")
(GRAPHSET 2 2 1 0.50 "LINE")
(GRAPHSET 3 1 0 0.20 "BAR")
# Label the Graph X axes
(LABEL 1 "Price and EMA")
(LABEL 2 indicator_name)
(LABEL 3 "Volume")
# Add the lines to our Graph
(GRAPHADD 1 "BLACK" "THINSOLID" (VLAST LOW DAYS))
(GRAPHADD 2 "BLACK" "THINSOLID" (VLAST HIGH DAYS))
(GRAPHADD 3 "BLACK" "THINSOLID" (VLAST OPEN DAYS))
(GRAPHADD 4 "BLACK" "THINSOLID" (VLAST CLOSE DAYS))
(GRAPHADD 5 "BLUE"  "THINSOLID" (VLAST EMA DAYS))
(GRAPHADD 6 "GREEN" "THINSOLID" (VLAST REG_MOM3 DAYS))
(GRAPHADD 7 "RED"   "THINSOLID" (VLAST MACD_Line DAYS))
(GRAPHADD 8 "BLACK" "THINSOLID" (VLAST ZERO DAYS))
(GRAPHADD 9 "GRAY"  "THINSOLID" (VLAST VOLUME DAYS))
# Show the graph we just generated
(SHOW)
-- Steve Kalhas
StockWiz.com
All rights reserved. © Copyright 2003, Technical Analysis, Inc.
Return to July 2003 Contents