ON-BALANCE VOLUME
Interviewed by BusinessWeek magazine late in the spring of 2002, legendary market forecaster and technical analyst Joseph Granville was asked, "Does technical analysis still work?" The journalist further wondered whether technical analysis is superior to Wall Street analysis, and if so, whether Granville's personal technical methods would work "forever." Granville's response was both classic Granville and classic market technician:
Of course. Truth is never out of date. There's only two things that can change the value of a stock - supply and demand, the only thing I teach.While Granville may be remembered by the mainstream more for his bold market forecasting and an excessively flamboyant style that allegedly included conducting investment seminars in costume (one account has Granville dressed as Moses, complete with tablets) and with the accompaniment of wild, if trained, animals (that same account features Granville with a piano-playing monkey), dedicated market technicians are more likely to recall him as the man who created the concept of on-balance volume. Now a staple of market analysis and a widely used technical indicator, on-balance volume was among the first group of technical indicators to take fully into account the relationship between price and volume.
First presented in Granville's New Strategy Of Daily Stock Market Timing For Maximum Profits, on-balance volume (OBV) sets up two categories: up-volume and down-volume.
When prices close lower today than they closed yesterday, then the volume of that day is considered down-volume and is assigned a negative value. When prices close higher than they closed yesterday, then the volume of that day is considered up-volume and is assigned a positive. In short, on-balance volume is a running total of down-volume and up-volume.

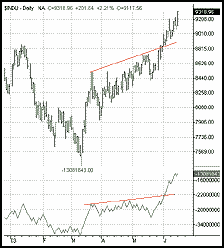
Figure 1: On-balance volume is a running total of down-volume and up-volume.
In a market that is in gear (to borrow STOCKS & COMMODITIES Staff Writer Dennis Peterson's helpful phrase) and healthy, on-balance volume will for the most part track price action. However, when a divergence between on-balance volume and price action occurs, it can be a signal that a change in price action - from up to down, flat to trending, and so on - may be in the making. As such, some market technicians directly overlay OBV on price action in order to more clearly note any divergences between the two.
Note in the chart of the Dow Jones Industrial Average (DJIA) how the on-balance volume indicator moves up at more or less the same pace as the Dow Jones industrials. When the on-balance volume indicator breaks out sharply to the upside in June, the Dow Jones industrials similarly breaks out in June. This correlation suggests that there is plenty of fuel for the DJIA to continue rallying - at least in the near term.
-David Penn, Staff Writer
Learn more about on-balance volume:
Achelis, Steven B. [1995]. Technical Analysis From A To Z, Probus
Publishing.
Cifaldi, Patrick [1991]. "Financial Volume Index And Volume Analysis,"
Technical
Analysis of STOCKS & COMMODITIES, Volume 9: April.
Evens, Stuart [1999]. "On-Balance Volume," Technical Analysis of
STOCKS
& COMMODITIES, Volume 17: March.
Granville, Joseph, and B. Granville [1976]. Granville's New Strategy
Of Daily Stock Market Timing For Maximum Profit, Simon & Schuster.
Holt, Phillip C. [1996]. "Enhancing On-Balance And Negative Volume,"
Technical
Analysis of STOCKS & COMMODITIES, Volume 14: June.
Kharif, Olga [2002]. "Joseph Granville's Profits Of Doom," BusinessWeek
Online (interview with Joseph Granville), May 15.
Murphy, John J. [1986]. Technical Analysis Of The Futures Markets,
New York Institute of Finance.
Sweeney, John [1997]. "On-Balance Volume," Technical Analysis of
STOCKS & COMMODITIES, Volume 15: October.
Shiller, Robert J. [2001]. Irrational Exuberance, Broadway Books.
Star, Barbara [1993]. "Volume Variations," Technical Analysis of
STOCKS
& COMMODITIES, Volume 11: May.
TradeStation (TradeStation Technologies)
Originally published in the August 2003 issue of Technical Analysis of STOCKS & COMMODITIES magazine. All rights reserved. © Copyright 2003, Technical Analysis, Inc.
Return to August 2003 Contents