Mutual Funds And Correlation
Serial Correlation Of One Rank
by Norman J. Brown
In two earlier articles, I demonstrated that the "one rank" (OR) switching technique depends on a low-value (less than 63) switching rate (S/Y), which in turn implies a longer than random up/down day streak period (more than four days). Here, I will investigate the methodology further, exploring enhanced streak periods using a well-known statistical method called correlation, implemented using Pearson's correlation coefficient, r (details are in the sidebar, "Calculating offset correlation, Osc1").
Estimating the magnitude of the OR performance required some simple equations that were developed to calculate the net up days captured from the yearly fund days (252). The average yearly up-day return was essentially equal to the average yearly down-day return; thus, a simple difference of days sufficed to calculate the resulting buy and hold (BH) or OR return.

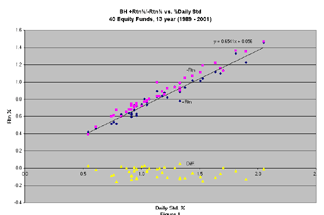
Figure 1: BUY AND HOLD RETURNS VS. STD. DEVIATION. Analyzing 40 equity funds from 1989 to 2001, you can see that the daily ROC (% return) of the mutual funds is directly proportional to their std (slope = 0.65). This shows that returns are enhanced by taking on more risk.
What if the average up return is 0.8%, but the average down-day return is only -0.1%, or worse, -0.9%? This calculates to a return of 79.7%, which is considerably different from the equal return assumption. Thus, the net day concept will lead to only an approximate result. In this article, I will present data comparing the calculated gain versus actual gain of buy and hold as well as for Orls. The results may surprise you.
...Continued in the October 2003 issue of Technical Analysis of STOCKS & COMMODITIES
Excerpted from an article originally published in the October 2003 issue of Technical Analysis of STOCKS & COMMODITIES magazine. All rights reserved. © Copyright 2003, Technical Analysis, Inc.
Return to October 2003 Contents