Who's In Control?
Bull And Bear Balance Indicator
by Vadim Gimelfarb
This new indicator analyzes the balance between the bulls and the bears.
Every day at the stock exchanges, a battle is waged between the buyers ("bulls"), who are trying to push prices up, and the sellers ("bears"), who want to push prices down. The end of the day sees a higher or lower price compared to the day before, depending on who wins, while the intermediate results and the maximum and minimum prices show the course of the battle during the day. Since the shifting of power between the bulls and the bears is one of the first signs of a probable turn of trend, the task of estimating this balance has often drawn the attention of stock market analysts, who offer varying solutions.
THE ELDER-RAY INDICATOR
The most popular method of estimating this power struggle between the bulls and the bears is the Elder-ray indicator, which was developed and described by technician Alexander Elder. Elder based the indicator on the following premises:
- The moving average is the agreed-upon price between the sellers and buyers during a certain period of time
- The maximum price reflects the maximum power of the buyers during the day; and
- The minimum price reflects the maximum power of sellers during the day.
On the basis of these premises, Elder defines the bull power as the difference between the maximum price and the 13-day exponential moving average (H-Ema). The bear power is the difference between the minimum price and the 13-day exponential moving average (L-Ema).
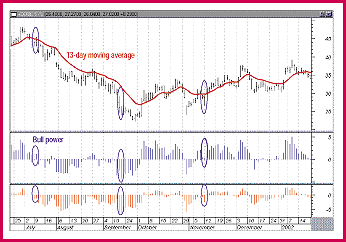
Figure 1: THE ELDER-RAY INDICATOR. In this chart of Adobe Systems you can see areas where there are discrepancies in the indicator.
...Continued in the October 2003 issue of Technical Analysis of STOCKS & COMMODITIES
Excerpted from an article originally published in the October 2003 issue of Technical Analysis of STOCKS & COMMODITIES magazine. All rights reserved. © Copyright 2003, Technical Analysis, Inc.
Return to October 2003 Contents