CHARTING THE MARKETS
Trendlines
First job- first car- first love- There is always something to be said for what comes first. Even if your first job was as stimulating as manual labor on a Virginia plantation, your first car an always-broken-down clunker, and your first love a raving lunatic, it's still hard to forget the first.
When it comes to technical tools and indicators, trendlines were "the first" technical tool for a sizable number of budding technical analysts. In fact, I suspect that most technicians can remember the first time they ever pulled up a price chart of some stock or commodity and drew their first trendline. How easy it all seemed then!
Unfortunately, just as everything seems to become more complicated the older we get, most technicians come to learn that even the simple, humble trendline can be problematic. As Jack Schwager discussed with Victor Sperandeo during one of the interviews that make up Schwager's book, The New Market Wizards, many traders and technicians have found that trendlines can be "particularly unreliable." Schwager elaborates in his book, The Complete Guide To The Futures Markets:
Trendlines and channels are useful, but their importance is often overstated. It is easy to overestimate the reliability of trendlines when they are drawn with the benefit of hindsight. A consideration that is frequently overlooked is that trendlines often need to be redrawn as a bull or bear market is extended. Thus, although the penetration of a trendline will sometimes offer an early warning signal of trend reversal, it is also common that such a development will merely require a redrawing of the trendline.
So what is a trendline and how is it drawn? My introduction to trendlines came courtesy of John J. Murphy, who in his Technical Analysis Of The Futures Markets describes trendlines thusly:
The basic trendline is one of the simplest of the technical tools employed by the chartist, but is also one of the most valuable in futures trading. An up trendline is a straight line drawn up to the right along successive reaction lows- A down trendline is drawn down to the right along successive rally peaks-
One of the best descriptions of how to actually draw a trendline, in my opinion, is the one provided by Sperandeo in his conversation with Jack Schwager. The beauty of Sperandeo's approach to drawing trendlines is that the trendline is consistent each time it is drawn. Too often, technicians try to force a certain trendline to conform to price action by ignoring or discounting inconvenient price bars. Sperandeo's method cuts such "incorrect" trendline drawing to the quick:
In the case of an uptrend line, you draw the line from the lowest low to the highest low immediately preceding the highest high, making sure that the connecting point you select does not result in the trendline passing through any prices between the two points.
As you might imagine, the case of the downtrend line is just the opposite: a line from the highest high to the lowest high immediately preceding the lowest low. Again, be careful the connecting point does not force the trendline to slice through even a single price bar. If it does, then the trendline is probably too long for the real trend.
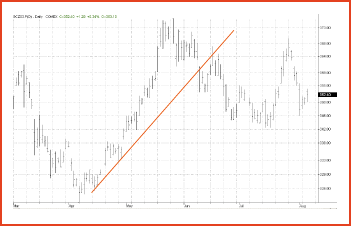
Consider the trendline in Figure 1, a chart of December gold. Typically, traders look to take advantage of strong moves crossing above or below trendlines, while often using some other confirming tool (such as an indicator) or simply confirming price action (such as a follow-through day or a test of the trendline for support or resistance) in order to determine entry opportunities. Here, notice how prices break beneath the trendline in early June, move up to test the trendline in mid-June and, in the wake of the successful test, retreat back beneath the area where prices first broke the trendline.

FIGURE 1: TRENDLINE. The breaking of this trendline marks the end of this rally in December gold.
--David Penn, Technical Writer
Learn more about trendlines!
Bowman, Melanie F., and Thom Hartle [1991]. "Trendlines," Technical Analysis of STOCKS & COMMODITIES, Volume 9: February.
Bulkowski, Thomas N. [2002]. "The Truth About Trendlines," Technical Analysis of STOCKS & COMMODITIES, Volume 20: October.
Faber, Bruce [1995]. "Trendlines," Technical Analysis of STOCKS & COMMODITIES, Volume 13: March.
Luisi, Joe [1996]. "Trendlines As A Technical Tool," Technical Analysis of STOCKS & COMMODITIES, Volume 16: March.
Merrill, Arthur [1988]. "Computing Curved Trendlines," Technical Analysis of STOCKS & COMMODITIES, Volume 6: August.
Murphy, John J. [1986]. Technical Analysis Of The Futures Markets, New York Institute of Finance/Prentice Hall.
Peterson, Dennis D. [2002]. "Trendlines And Consolidations," Working Money: May.
Schwager, Jack D. [1984]. The Complete Guide To The Futures Markets, John Wiley & Sons.
_____ [1992]. The New Market Wizards, John Wiley & Sons.
Originally published in the October 2003 issue of Technical Analysis of STOCKS & COMMODITIES magazine. All rights reserved. © Copyright 2003, Technical Analysis, Inc.
Return to October 2003 Contents