OPTIONS
Handling Positions
Trading With Open Interest
by John Boere
Analyzing the open interest of equities can provide insight into the direction of the market. Find out why the expiration price is being manipulated, how it can be calculated, and how you can trade it.
Open interest is the number of open contracts of a given option series. An open contract is one that is not exercised, closed, or expired. One unit of open interest represents two parties: a buyer (long) and a seller (short). Open interest increases when a buyer opens a long position and a seller opens a short position at the same time. Open interest decreases when a buyer sells/closes a long position and a seller closes/covers a short position.
The examples I use in this article are of options traded on the Amsterdam general index (AEX). This index is highly liquid and contains the top 25 Dutch companies, some of them the world's largest: Shell Oil, Unilever, ING, and Royal Philips Electronics. The AEX closely follows the Standard & Poor's 500 index.
EXPIRATION
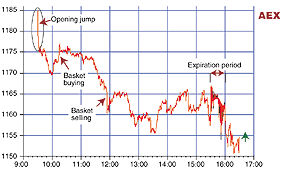
Options expiration normally takes place on the third Friday of the month. A number of options series expire on this day, including stock, index, and futures options. The expiration (or settlement) price of the AEX is determined by averaging values between 3:30 and 4:00 pm using 31 one-minute samples. On the intraday chart in Figure 1, it is clear that the expiration period is more active. This proves that the option expiration affects market movements.
Certain months of the year tend to have a higher open interest because longer-term options are available. These months include January, April, July, and especially October, which is when multiyear options expire. Price movements near the expiration of these months tend to be more volatile

Figure 1: Intraday chart on expiration day. Note that options trading is most active during the expiration period.
...Continued in the November 2003 issue of Technical Analysis
of STOCKS & COMMODITIES
Excerpted from an article originally published in the November 2003 issue of Technical Analysis of STOCKS & COMMODITIES magazine. All rights reserved. © Copyright 2003, Technical Analysis, Inc.
Return to November 2003 Contents