November 2003
TRADERS' TIPS
You can copy these formulas and programs for easy use in your spreadsheet or analysis software. Simply "select" the desired text by highlighting as you would in any word processing program, then use your standard key command for copy or choose "copy" from the browser menu. The copied text can then be "pasted" into any open spreadsheet or other software by selecting an insertion point and executing a paste command. By toggling back and forth between an application window and the open Web page, data can be transferred with ease.
This month's tips include formulas and programs for:
or return to November 2003 ContentsTRADESTATION: Zigzag Trend Indicator
![]() TRADESTATION:
Zigzag Trend Indicator
TRADESTATION:
Zigzag Trend Indicator
Spyros Raftopoulos's article in this issue, "The Zigzag Trend Indicator," describes a method of deducing trend from reversal filters. In earlier articles, Raftopoulos described methods for charting zigzags, but his zigzag validity indicator only displayed the "locked" high and low, not the moment when the retracement criteria were met. Raftopoulos's new zigzag trend indicator, described in this issue, can now display this previously undisplayed information on the chart.
TradeStation has a built-in zigzag indicator that performs the retracement-based zigzag validity charting described by Raftopoulos. To recreate the zigzag trend chart (Figure 1), we simply add a plot statement marking the point at which the retracement threshold was achieved. The indicator simply jumps from a low extreme (downtrend) to a high extreme (uptrend).
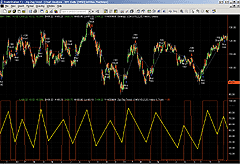
Figure 1: TRADESTATION, ZIGZAG TREND INDICATOR. TradeStation's built-in zigzag indicator performs the retracement-based zigzag validity charting. As described in Spyros Raftopoulos's article, the zigzag trend indicator can be applied to calculated values rather than price data. Here, Chande momentum oscillator (CMO) zigzags are displayed.
Raftopoulos also describes applying the zigzag trend indicator to
calculated values rather than to price data. He uses the Chande momentum
oscillator (CMO) as an example. The CMO doesn't come with TradeStation,
so we created an EasyLanguage version, following the article's example.
The workspace settings for properly displaying the CMO zigzags will be
posted in the file library at TradeStationWorld.com. The file will contain
the workspace and the following code:
Function: TL_Zigzag
inputs:
 Price( numericseries ),
 RetraceMethod( numericsimple ), { 1 = percent, 2 = number }
 retrace( numericsimple ),
 LineColor( numericsimple ),
 LineWidth( numericsimple ),
  PlotLine( truefalse ) ;
variables:
 NewSwingPrice( 0 ),
 SwingPrice( Price ), { used as a convenient 2-element array }
 SwingDate( Date ), { used as a convenient 2-element array }
 SwingTime( Time ), { used as a convenient 2-element array }
 TLDir( 0 ), { TLDir = -1 implies prev TL dn, +1 implies prev TL up }
 RetraceFctrUp( 1 + retrace * .01 ),
 RetraceFctrDn( 1 - retrace * .01 ),
 SaveSwing( false ),
 AddTL( false ),
 UpdateTL( false ),
 TLRef( 0 ),
 ZigZagTrend( 0 ) ;
{ Candidate swings are just confirmed, 3-bar (Str=1), SwingHi's and SwingLo's }
NewSwingPrice = SwingHigh( 1, Price, 1, 2 ) ;
if NewSwingPrice  <> -1 then
 begin
 if ( RetraceMethod = 1 and TLDir <= 0 and NewSwingPrice >= SwingPrice
  * RetraceFctrUp ) or ( RetraceMethod = 2 and TLDir <= 0 and NewSwingPrice
  >= SwingPrice + Retrace ) then
  { prepare to add new up TL }
  begin
  SaveSwing = true ;
  AddTL = true ;
  TLDir = 1 ;
  end
 else if TLDir = 1 and NewSwingPrice >= SwingPrice then
  { prepare to update prev up TL }
  begin
  SaveSwing = true ;
  UpdateTL = true ;
  end ;
 end
else
 begin
 NewSwingPrice = SwingLow( 1, Price, 1, 2 ) ;
 if NewSwingPrice <> -1 then
  begin
  if (RetraceMethod = 1 and TLDir >= 0 and NewSwingPrice <= SwingPrice
  * RetraceFctrDn) or (RetraceMethod = 2 and TLDir >= 0 and NewSwingPrice
  <= SwingPrice - retrace ) then
   { prepare to add new dn TL }
   begin
   SaveSwing = true ;
   AddTL = true ;
   TLDir = -1 ;
   end
  else if TLDir = -1 and NewSwingPrice <= SwingPrice then
   { prepare to update prev dn TL }
   begin
   SaveSwing = true;
   UpdateTL = true ;
   end ;
  end ;
 end ;
if SaveSwing then
 { save new swing and reset SaveSwing }
 begin
 SwingPrice = NewSwingPrice ;
 SwingDate = Date[1] ;
 SwingTime = Time[1] ;
 SaveSwing = false ;
 end ;
if AddTL then
 { add new TL and reset AddTL }
 begin
 if Plotline then
  begin
TLRef = TL_New( SwingDate, SwingTime, SwingPrice, SwingDate[1], SwingTime[1], SwingPrice[1] ) ;
  TL_SetExtLeft( TLRef, false ) ;
  TL_SetExtRight( TLRef, false ) ;
  TL_SetSize( TLRef, LineWidth ) ;
  TL_SetColor( TLRef, LineColor ) ;
  end ;
 AddTL = false ;
 end
else if UpdateTL then
 { update prev TL and reset UpdateTL }
 begin
 if PlotLine then
  TL_SetEnd( TLRef, SwingDate, SwingTime, SwingPrice ) ;
 UpdateTL = false ;
 end ;
TL_ZigZag = SwingPrice ;
Indicator: Zigzag Trend
inputs:
 Price( Close ),
 RetraceMethod( 1 ), { 1 = percent, 2 = number }
 retrace( .75 ),
 LineColor( Yellow ),
 LineWidth( 1 ),
  PlotLine( true ) ;
variables:
 SwingPrice( Price ), { used as a convenient 2-element array }
 ZigZagTrend( 0 ) ;
{ Candidate swings are just-confirmed, 3-bar (Str=1), SwingHi's and SwingLo's }
SwingPrice = TL_ZigZag( Price, RetraceMethod, retrace, LineColor, LineWidth, PlotLine ) ;
if SwingPrice > SwingPrice[1] then
begin
 print( SwingPrice, " ", SwingPrice[1] ) ;
 ZigZagTrend = 1 ;
 end
else if SwingPrice < SwingPrice[1] then
 begin
 ZigZagTrend = -1 ;
 end ;
Plot1( ZigZagTrend, "Zig" ) ;
print( date, " ", time, " ", SwingPrice, " ", SwingPrice[1], " ", zigZagtrend ) ;
Strategy: Zigzag Trend Strat
inputs:
 Price( Close ),
 RetraceMethod( 1 ), { 1 = percent, 2 = number }
 retrace( .75 ),
 LineColor( Yellow ),
 LineWidth( 1 ),
  PlotLine( true ) ;
variables:
 SwingPrice( Price ), { used as a convenient 2-element array }
 ZigZagTrend( 0 ) ;
{ Candidate swings are just-confirmed, 3-bar (Str=1), SwingHi's and SwingLo's }
SwingPrice = TL_ZigZag( Price, RetraceMethod, retrace, LineColor, LineWidth, PlotLine ) ;
if SwingPrice > SwingPrice[1] then
begin
 ZigZagTrend = 1;
 end
else if SwingPrice < SwingPrice[1] then
 begin
 ZigZagTrend = -1;
 end;
if ZigZagTrend =1 and ZigZagTrend[1]= -1 then
 buy next bar at market
else if ZigZagTrend =-1 and ZigZagTrend[1]= 1 then
 sellshort next bar at market ;
Function: CMO
inputs:
 Length( numericsimple );
variables:
 CMO_1(0),
 CMO_2(0),
 CMO_Final(0);
if C > C[1] then
 begin
 CMO_1 = C - C[1] ;
    CMO_2 = 0 ;
 end
else
 begin
 CMO_1 = 0 ;
 CMO_2 = C[1] - C ;
 end;
Value1 = Summation( CMO_1, Length );
Value2 = Summation( CMO_2, Length ) ;
CMO = ( Value1 - Value2 )/( Value1 + Value2 ) * 50 + 50 ;
Indicator: CMO
inputs:
 Length( 14 ) ;
if CurrentBar > Length then
 Plot1( CMO( Length ), "CMO" ) ;
Plot2( 0, "Zero" ) ;
print( plot1 ) ;
A zip file including the above EasyLanguage coding and an associated
workspace will be available for download from the EasyLanguage Exchange
on www.tradestationworld.com. Look for the file "ZigZag Trend.zip."
-- Mark Mills, MarkM@TSSec
EasyLanguage Questions Forums
TradeStation Securities, Inc.
www.TradeStationWorld.com
![]() TRADESTATION:
Casino Trading
TRADESTATION:
Casino Trading
"Casino Trading" by Phil Abel in this issue describes a method of deducing probability distributions for a given game strategy. Abel hypothesizes that we can treat the market like a random process, one in which a history of trades offers no inference about future trades. To illustrate this, his example is a system that wins 35% of the time, earning $2,000 per win. It takes a $1,000 loss 65% of the time. In any given set of 1,000 trades, we should have 350 winners ($700,000 gain) and 650 losers ($650,000 loss). Thus, we should expect to make $50,000 per 1,000 trades.
Despite the favorable odds, these statistics don't answer the question, "What is the probability that I'll lose half my money and be forced to quit and take a permanent loss?" Abel answers this question with his Monte Carlo simulation of 50,000 traders using the above strategy for 1,000 trades. From the 50,000 cases, a probability distribution function can be built and the chance of a 50% loss read directly from the chart.
Many readers will wonder how to get their strategy into a simulator, and get 50,000 trials of 1,000 trade sequences. One way is to create a "strategy result library," then randomly select trades from the library. Following Abel's example, I wrote a simple trading strategy. It randomly takes a long or short position, then exits when there is a 2% gain or 1% loss. After exiting, it randomly takes another long or short position.
Now that we have a simple strategy (you can make yours as complex as you like), we can use TradeStation RadarScreen to generate the "library" of trades. Figure 2 shows the RadarScreen that generates simulated trading results for the 100 component stocks that make up the Standard & Poor's 100 index. Each output line contains a "line number," stock symbol, charting interval, and the number of days since a trade occurred.
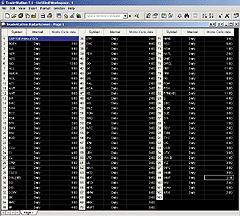
Figure 2: TRADESTATION, MONTE CARLO SIMULATION. RadarScreen generates the simulated trading results for the 100 component stocks that make up the Standard & Poor's 100 index. Each output line contains a "line number," stock symbol, charting interval, and the number of days since a trade occurred.
The EasyLanguage code writes each simulated trade to a text file.
In my case, I used three years of daily data to produce 50,000 trades of
S&P 100 component stocks. Once I inserted my simple strategy into RadarScreen,
it took only about 30 minutes to produce the 15,000 trades needed for my
"strategy trade library."
Once you have your library, you can run a Monte Carlo simulation in Excel or a variety of other programs. I used Excel. I replaced the "roulette wheel" outcome generator with a random selection of trades from my "library," summed them, and produced a simulated outcome. I used a macro to produce 1,000 hypothetical trade sequences and quickly got a probability distribution and an estimate of the strategy's chance of bankruptcy.
Indicator: Monte Carlo Data
inputs:
 PercentGain( .02 ) ,
 PercentLoss( .01 ) ;
variables:
 MyPosition( 0 ),
  MyEntry( 0 ),
 MyProfitTarget( 0 ),
 MyStop( 0 ),
  BarsIn( 0 ),
    MyStr( " " ) ;
if MyPosition = 0 then
 begin
 MyEntry = Close ;
 { Randomly takes long ( 1 ) or short ( -1 ) }
 MyPosition = Round( Random( 1 ), 0 ) * 2 - 1 ;
 BarsIn = 0 ;
 end ;
{ if entry bar, create target and stop }
if BarsIn = 0 then
 begin
 MyProfitTarget = ( ( MyPosition * PercentGain ) + 1 )
  * MyEntry ;
 MyStop = ( - ( MyPosition * PercentLoss ) + 1 )
  * MyEntry ;
 end ;
if BarsIn > 0 then
 begin
 if MyPosition = 1
  and ( Close > MyProfitTarget
  or Close < MyStop )
 then
  begin
  MyStr = GetSymbolName + " " + NumToStr( date, 0 )
   + " " + NumToStr( time, 0 ) + " "
   + NumToStr( MyPosition, 0 ) + " "
   + NumToStr( MyEntry, 2 ) + " "
   + NumToStr( Close, 2 ) + " "
   + NumToStr( MyProfitTarget, 2 ) + " "
   + NumToStr( MyStop, 2 )
   + " " + NumToStr( ( Close - MyEntry )
   / Myentry, 4 ) +  " " +  NumToStr( BarsIn , 0 )
   + NewLine ;
  FileAppend( "C:/MonteCarloTest.txt", MyStr ) ;
  MyPosition = 0 ;
  end ;
 If MyPosition = -1
  and ( Close < MyProfitTarget
  or Close > MyStop )
 then
  begin
  MyStr = GetSymbolName + " " + NumToStr( date, 0)
    + " " + NumToStr( time, 0 ) + " "
   + NumToStr( MyPosition, 0 ) + " "
   + NumToStr( MyEntry, 2 ) + " "
   + NumToStr( Close, 2 ) + " "
   + NumToStr( MyProfitTarget, 2 ) + " "
   + NumToStr( MyStop, 2 ) + " "
   + NumToStr( ( MyEntry - Close ) / Myentry,4 )
   +  " " +  NumToStr( BarsIn, 0 )+ NewLine ;
  FileAppend( "C:/MonteCarloTest.txt", MyStr ) ;
  MyPosition = 0 ;
  end ;
 end ;
BarsIn = BarsIn + 1 ;
Plot1( BarsIn ) ;
print( "*" ) ;
An ELD file will be available for download from the EasyLanguage
Exchange on www.tradestationworld.com. Look for the file "Monte
Carlo data.Eld."
-- Mark Mills, MarkM@TSSec
EasyLanguage Questions Forums
TradeStation Securities, Inc.
www.TradeStationWorld.com
![]() AMIBROKER:
Zigzag Trend Indicator
AMIBROKER:
Zigzag Trend Indicator
In this issue's "The Zigzag Trend Indicator," Spyros Raftopoulos presents an enhancement of his zigzag validity indicator. His new zigzag trend indicator is an attempt to address shortcomings (mainly the "last leg" problem) of classic zigzag. The technique involves delaying the response of the indicator as long as the reversal amount is reached and the last leg of the zigzag line becomes valid.
This can be easily reproduced in AmiBroker using its native AFL language. Listing 1 shows ready-to-use code that can be applied in the Indicator Builder. It also includes a very basic reversal trading system to be applied in the Automatic Analysis window. The percentage-reversal amount can be changed on the fly without modifying the code using the Parameters window.
LISTING 1
array = Close;
amount = Param("Amount", 15.5, 1, 50, 0.5 );
zz0 = Zig( array, amount );
zz1 = Ref( zz0, -1 );
zz2 = Ref( zz0, -2 );
tr = ValueWhen(zz0 > zz1 AND zz1 < zz2, zz1);
pk = ValueWhen(zz0 < zz1 AND zz1 > zz2, zz1);
PU = tr + 0.01 * abs(tr)*amount;
PD = pk - 0.01 * abs(pk)*amount;
ZZT = IIf( array >= PU AND zz0 > zz1, 1,
IIf( array <= PD AND zz0 < zz1, -1, 0 ) );
ZZT = ValueWhen( ZZT != 0, ZZT );
// plot price bar chart
Plot( Close, "Price", colorBlack, styleBar );
// plot Zigzag and zigzag trend
Plot( ZZT, "ZigZagTrend", colorRed, styleOwnScale );
Plot( zz0, "ZigZag line", colorBlue, styleThick );
// Plot the ribbon
ribboncol= IIf( ZZT > 0, colorGreen, colorRed );
Plot( 2, "ZZT Ribbon", ribboncol, styleArea | styleOwnScale | styleNoLabel, 0, 100 );
GraphXSpace = 10;
Buy = Cover = Cross( ZZT, 0 );
Sell = Short = Cross( 0, ZZT );
// plot arrows
PlotShapes( Buy + 2 * Sell, ribboncol, 0, IIf( Buy, L, H ), -30 );
A downloadable version of this formula is available from AmiBroker's
website. The sample chart in Figure 3 of Boeing has a classic 15% zigzag
line (blue), square-shaped zigzag trend indicator (dark gray), and trend
ribbon in the upper pane. The lower pane shows the equity curve of the
simple reversal trading system given in Listing 1, compared to a buy-and-hold
equity curve (blue line).
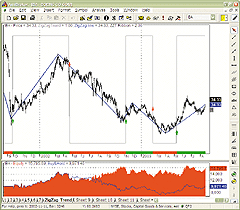
Figure 3: AMIBROKER, ZIGZAG TREND INDICATOR. This AmiBroker chart shows a daily Boeing bar chart with a classic 15% zigzag line (blue), square-shaped zigzag trend indicator (dark gray), and trend ribbon in the upper pane. The green arrows show long entry points, and red arrows show short entry points. The lower pane shows the equity curve (red area) of the simple reversal trading system given in Listing 1 compared to a buy-and-hold equity curve (blue line).
--Tomasz Janeczko, AmiBroker.com
www.amibroker.com
![]() AMIBROKER:
CASINO TRADING
AMIBROKER:
CASINO TRADING
In "Casino Trading," Phil Abel presents methods of evaluating trading system robustness using Monte Carlo simulation. To perform a Monte Carlo simulation, we would need a "decision tree" -- a set of data showing probabilities of profits in a given range.
As the author suggests, we could derive such a decision tree from an individual trade list produced by the backtester, but we will show a slightly more automatic method that involves using AmiBroker's exploration mode.
Listing 1 shows the exploration formula to be applied in the Automatic Analysis window. In our example, we have used a very simple EMA crossover system, but the user can replace it with any other system. The code produces a table that shows the number of winning/losing trades, total number of trades, and percentage probabilities of profits in user-defined ranges. In the sample code below, we have used 25 ranges for winning trades (0..100, 100..200, .., 2400...infinity), and a similar 25 ranges for losing trades. The user can modify both the number of ranges evaluated and the size of the range by modifying appropriate variables in the code. Once the exploration is complete, the results can be exported to a CSV file for further analysis in Excel.
LISTING 1
///// Trading system to be evaluated
Buy = Cross( Close, EMA(Close, 15) );
Sell = Cross( EMA(Close, 15), Close );
///////////////////////////////////
e = Equity(1);
tradeend = Sell;
profit = e - ValueWhen( Buy, e );
endprofit = IIf( tradeend , profit, 0 );
LosingTrades = LastValue( Cum( endprofit < 0 ) );
WiningTrades = LastValue( Cum( endprofit > 0 ) );
TotalTrades = LastValue( Cum( tradeend ) );
AddColumn( LosingTrades, "Losing trades", 1 );
AddColumn( WiningTrades, "Wining trades", 1 );
AddColumn( TotalTrades, "Total trades", 1 );
Filter = Status("lastbarinrange");
// now we will count the number of
// count trades winning in given $ ranges
NumRanges = 25; // number of ranges to generate
RangeSize = 100; // controls $ size of the range
for( i = 0; i < NumRanges; i++ )
{
  rangestart = i * RangeSize;
  rangeend = (i+1)*RangeSize;
  if( i == NumRanges - 1 ) rangeend = 999999;
  AddColumn(
  LastValue( 100* Cum( endprofit > rangestart AND endprofit < rangeend ) /TotalTrades ),
  "% with profit " + rangestart + ".." + rangeend );
}
for( i = 0; i < NumRanges; i++ )
{
  rangestart = (-i - 1 ) * RangeSize;
  rangeend = -i*RangeSize;
  if( i == NumRanges - 1 ) rangestart = -999999;
  AddColumn(
  LastValue( 100* Cum( endprofit > rangestart AND endprofit < rangeend ) /TotalTrades ),
  " % with loss " + rangeend + ".." + rangestart );
}
A sample Monte Carlo spreadsheet for AmiBroker can be found
in the files area of AmiBroker's mailing list at https://groups.yahoo.com/group/amibroker/files/.
--Tomasz Janeczko, AmiBroker.comGO BACK
www.amibroker.com
![]() Wealth-Lab:
Zigzag Trend Indicator
Wealth-Lab:
Zigzag Trend Indicator
To realize the zigzag trend (ZZT) indicator in Wealth-Lab Developer 3.0, we simply modified the ZigZag study already included with the installation, and, with the help of the New Indicator Wizard, we developed the ZZT custom indicator. Once they are programmed and added to the Indicators folder, custom indicators are available for use in any ChartScript after making the appropriate $Include reference (see sample script).
In addition, we created a more versatile study, ZigZagX, to provide the ability to plot zigzag lines on any price series or indicator in any chart pane. Whereas the original zigzag study draws only confirmed reversals, ZigZagX tacks on the most recent "revisable" reversal line(s). Both of the new zigzag scripts are available at the Wealth-Lab.com website for use in the online program version of Wealth-Lab as well as for download into Wealth-Lab Developer 3.0, the desktop version.
At the risk of duplicating the work of the article's author, we scripted the buy-and-reverse 45-point ZZT application on a 15-period CMO. A simulation over the same period on IBM (10% equity sizing with a $100,000 account and $15-per-trade commissions) produced an annualized gain of 5.3%, while buy and hold reduced the account by 5.15% annually. A sample plot of both indicators in Wealth-Lab 3.0 is shown in Figure 4.
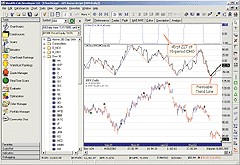
Figure 4: WEALTH-LAB, ZIGZAG TREND INDICATOR. The final trendline in the ZigZagX study is a confirmed trend, yet it is still subject to revisions.
WealthScript Code:
{$I 'ZigZagX Study'}
{$I 'ZZT'}
var Bar, p, CMOh, ZZTh, CMOPane, ZZTPane: integer;
const UsePointReversal = true;
HideVolume;
EnableTradeNotes( false, true, false );
CMOPane := CreatePane( 125, true, true );
ZZTPane := CreatePane( 75, true, true );
CMOh := CMOSeries( #Close, 15 );
PlotSeriesLabel( CMOh, CMOPane, #Black, #Thin, 'CMOh=CMO(#Close,15)' );
ZZTh := ZZTSeries( CMOh, 45, UsePointReversal );
PlotSeriesLabel( ZZTh, ZZTPane, #Navy, #Dotted, 'ZZTh=ZZT(CMOh,45,true)' );
{ Draw the ZigZagX study (optional) }
ZigZagX( CMOh, CMOPane, 45, UsePointReversal );
{ Implement trading system rules }
for Bar := 15 to BarCount - 1 do
begin
  if LastPositionActive then
  begin
    p := LastPosition;
    if PositionLong( p ) then
      if TurnDown( Bar, ZZTh ) then
        SellAtMarket( Bar + 1, p, '' );
    if PositionShort( p ) then
      if TurnUp( Bar, ZZTh )then
        CoverAtMarket( Bar + 1, p, '' );
  end;
  if not LastLongPositionActive then
    if TurnUp( Bar, ZZTh ) then
      BuyAtMarket( Bar + 1, '' );
  if not LastShortPositionActive then
    if TurnDown( Bar, ZZTh ) then
      ShortAtMarket( Bar + 1, '' );
end;
-- Robert Sucher
Wealth-Lab, Inc.
www.wealth-lab.com
![]() Wealth-Lab:
Casino Trading
Wealth-Lab:
Casino Trading
The task of programming the decision tree of possible outcomes of real trading systems can become rather ominous. Consider the profit distribution of a typical trading system, shown in Figure 5. In our implementation of the program presented here, the win/loss ratio is automatically calculated from this information, as are the probabilities of each trade.
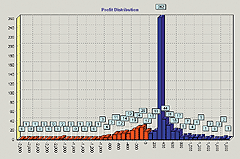
Figure 5: WEALTH-LAB, MONTE CARLO SIMULATION. Profit distribution histograms are generated automatically for all simulations in Wealth-Lab Developer 3.0. You have the option of displaying the results in percent, dollar, or points.
To speed up the generation of the Monte Carlo trials, we leveraged
the Com add-on feature of the WealthScript language and performed the chore
in an ActiveX component, named WLMonteCarlo, written in Visual Basic 6.
("Com" is Microsoft's Component Object Model, which
defines the protocols to interface software applications.)
WLMonteCarlo reads the profit distribution, calculates the winning percentage of trades, and then creates two probability tables -- one for wins and another for losses. These tables are sorted to produce a graduated probability from zero to 1. Since we can loop through the table to locate the trade result with the appropriate probability, it's not necessary to edit the program each time you want to run a Monte Carlo simulation on new trading system results.
The trial results are ultimately fed back to the ChartScript in Wealth-Lab, which calculates, scales, and displays the Monte Carlo probability distribution. Sample equity curves are generated by the EquityCurve method of WLMonteCarlo and plotted in a separate chart pane.
Obtaining the Monte Carlo probability distribution in Wealth-Lab can be reduced to the following procedure:
1. Run a portfolio simulation on a WatchList using the $imulator tool, or simply find the raw-profit characteristics of a system in the ChartScript window.In Figure 6, we provide the output of the system having the profit distribution given in Figure 5. It's interesting that the risk of ruin was found to be zero percent for this particular system, which notches consistent profits with a winning percentage of about 56%. These findings support the notion that less-risky trading systems lead to stable and consistent profits.
2. Following the simulation, click on the Profit Distribution view and select Dollar in the dropdown control.
3. Create a comma-delimited file of the profit histogram by entering the dollar profit (or loss) followed by a comma, and finally the number of observations.
4. Run the Casino Trading script in a ChartScript window. (A Monte Carlo simulation involving 50,000 trials could take several minutes, so ensure that you have your Script Timeout setting at zero in the Options Dialog.)
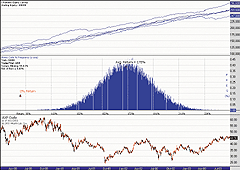
Figure 6: WEALTH-LAB, MONTE CARLO SIMULATION. Random equity curves and the Monte Carlo probability distribution are plotted in separate panes on an arbitrary chart window.
The ComCasinoTrading ChartScript and its WLMonteCarlo component
are available for download from the Wealth-Lab.com website for use with
Wealth-Lab Developer 3.0. Instead of using a third party-application, we
programmed the PDF analysis directly in the ChartScript. The resulting
code is rather esoteric and not necessarily appropriate to divulge here.
Instead, to whet your appetite, we leave you with a code fragment from
the ComCasinoTrading script that exercises the main methods of the WLMonteCarlo
Com component.
WealthScript Code fragment:
{ This fragment is intentionally incomplete }
const STARTING_BANKROLL = 100000;
const TOTAL_TRIALS = 50000;
const TRADES_PER_TRIAL = 1000;
const EQUITY_SIMS = 5;
var MC: ComVariant;
var EQcurve: array[1..EQUITY_SIMS] of integer;
{ Prepare a TList to hold trade results }
lst := TList.Create;
MC := CreateOleObject( 'WLMonteCarlo.CasinoTrials' );
WinPct := MC.ReadData( 'C:\ProfitDist.csv' );
MC.Execute( STARTING_BANKROLL, TOTAL_TRIALS,
  TRADES_PER_TRIAL, IWealthLabAddOn3 );
{ Place the sorted trial results in a TList for handling }
repeat
  lst.Add( MC.TrialValue() );
until not MC.NextDataPoint();
{ Create the Equity curves }
for L := 1 to EQUITY_SIMS do
begin
  EQcurve[ L ] := CreateSeries;
  MC.EquityCurve( STARTING_BANKROLL, TRADES_PER_TRIAL,
                  EQcurve[ L ], IWealthLabAddOn3 );
end;
PrintStatus( 'Creating Distribution' );
Distribute( lst );
-- Robert Sucher
Wealth-Lab, Inc.
www.wealth-lab.com
![]() NEUROSHELL
TRADER: Zigzag Trend Indicator
NEUROSHELL
TRADER: Zigzag Trend Indicator
The zigzag trend indicator described by Spyros Raftopoulos in this issue can be easily implemented in NeuroShell Trader using NeuroShell Trader's ability to call external Dynamic Linked Libraries. Dynamic Linked Libraries may be written in C, C++, Power Basic (also Visual Basic using one of our add-on packages), and Delphi.
We've created a ZigZagPnts and ZigZag Trend indicator that you can download from the NeuroShell Trader free technical support website. In addition, we've provided the code on our website, so that if you wish to make any modifications to it, you will be able to do so.
After downloading the custom indicators, you can insert them by doing the following:
1. Select "New Indicator ..." from the Insert menu.After downloading the zigzag indicators, you can easily insert them or combine them with any of our 800 built-in indicators into a chart, prediction, or trading strategy. A sample chart is shown in Figure 7. In addition, if you decide to use the zigzag trend indicator in a prediction or a trading strategy, the coefficients may be optimized by the genetic algorithm built into NeuroShell Trader Professional. This can provide you with your own custom version of ZigZagTrend that fits your data best. (Note that as described in the article, the ZigZagPnts indicator should not be used for trading/backtesting.)
2. Select the Custom Indicator category.
3. Select the ZigZagPnts and ZigZag Trend indicator.
4. Select the parameters as you desire.
5. Select the Finished button.
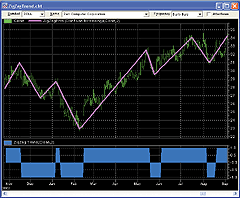
Figure 7: NEUROSHELL TRADER, ZIGZAG TREND INDICATOR. Here's a sample NeuroShell Trader chart demonstrating the zigzag and corresponding zigzag trend indicator.
Users of NeuroShell Trader can go to the STOCKS & COMMODITIES
section of the NeuroShell Trader free technical support website to download
a copy of this or previous Traders' Tips.
For more information on NeuroShell Trader, visit www.NeuroShell.com.
--Marge Sherald, Ward Systems Group, Inc.
301 662-7950, sales@wardsystems.com
www.neuroshell.com
![]() PROPHET.NET:
Zigzag Trend Indicator
PROPHET.NET:
Zigzag Trend Indicator
The zigzag trend indicator (ZZT) described by Spyros Raftopoulos in this issue is available, in both percentage and point form, on the Prophet.Net website to all premium members. No coding is required on the part of the user.
The Zzt indicator is available in the advanced studies suite in JavaCharts, found here:
Prophet.Net : Analyze : JavaCharts
https://www.prophet.net/analyze/javacharts.jsp
Click on the Tools menu (which you can also access by right-clicking
anywhere on a chart) and choose Apply Studies from the Studies menu item.
There are four styles of zigzag studies available from the dropdown menu:
You can choose any or all of these indicators within the Technical Studies dialog box (Figure 8), and you can set the percentage or point move for any of them in the Reversal Amount box; the figure you entered will be shown parenthetically with the indicator itself.ZigZag %--The classic zigzag indicator, using percent changes in price as its basis ZigZag $--The classic zigzag indicator, using point moves in price as its basis ZigZag Trend %--Raftopoulous's indicator, using percent changes in price as its basis ZigZag Trend $--Raftopoulous's indicator, using point changes in price as its basis
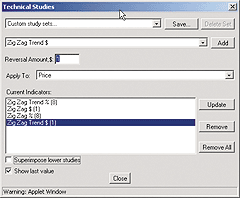
Figure 8: PROPHET.NET, ZIGZAG TREND INDICATOR, TECHNICAL STUDIES DIALOG BOX. You can choose any or all of these indicators within the Technical Studies dialog box.
You can use just one study, or combine them to compare the differences
both between point and percentage criteria, as well as between the classic
zigzag and the ZZT.
The Prophet JavaChart shown in Figure 9, for example, shows the zigzag indicator laid on top of the price chart, using an 8% move as its basis. Raftopoulos's new ZZT indicator is shown beneath, using similar criteria. The differences between these two, as mentioned in the article, can be seen clearly. The ZZT, as a binary indicator, oscillates between +1 (blue line at the top of the graph) and -1 (blue line on the bottom), with the changes represented by the vertical blue line.
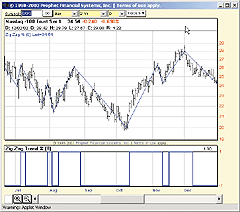
Figure 9: PROPHET.NET, ZIGZAG TREND INDICATOR. This Prophet JavaChart shows the zigzag indicator overlaid on the price chart, using an 8% move as its basis. The new ZZT indicator is shown in the lower pane.
Premium memberships at Prophet.Net start at $14.95 per month; real-time
market data is available for equities, options, and futures. A seven-day
trial is available by following this link, which provides immediate access
to the ZZT studies: https://www.prophet.net/tasc.
--Tim Knight, Prophet.netGO BACK
![]() NeoTicker:
Zigzag Trend Indicator
NeoTicker:
Zigzag Trend Indicator
NeoTicker already contains a built-in zigzag indicator that can plot the zigzag trend indicator values. Here are the steps to reproduce the charts shown in Spyros Raftopoulos's article in this issue, "The Zigzag Trend Indicator."
To reproduce the Boeing daily bar chart (Figure 3 in the article), add daily Boeing data into a chart. Then add the zigzag indicator by right-clicking on the Boeing data series to bring up the popup menu. Choose "Add Indicator" from the popup menu. In the Add Indicator window, set the parameter Type to "Percent" and the parameter Diff to "15." Click the Apply button to plot the zigzag indicator.
To show the trend direction values already computed by zigzag on the chart, you can use the Plot Value indicator to show those values in a separate pane. To add the Plot Value indicator, right-click on the zigzag indicator legend and choose "Add Indicator" from the popup menu. Adding indicators this way will tell NeoTicker to apply the new indicator Plot Value based on the zigzag indicator, as opposed to using the values from the Boeing daily data. To show the trend direction information of zigzag, set the parameter Plot to "3." Press the Apply button. The +1 and -1 zigzag trend values will be plotted. The price bar and the zigzag trend plot will look odd because the range of the data and indicator series is too wide. Just change the Plot Value indicator to use Overlay mode through the popup menu. The chart will then look exactly like the Boeing daily chart (Figure 10) presented in the article.
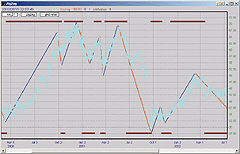
Figure 10: NEOTICKER, ZIGZAG TREND INDICATOR. This sample chart reproduces the Boeing chart shown in Spyros Raftopoulos's article in this issue. NeoTicker contains a built-in zigzag indicator that can plot the zigzag trend indicator values.
--Kenneth Yuen, TickQuest Inc.
www.tickquest.com
![]() NeoTicker:
Casino Trading
NeoTicker:
Casino Trading
TickQuest has a comprehensive tool called Equity Monaco that runs Monte Carlo simulations. We offer the Equity Monaco tool as freeware, downloadable from the TickQuest website along with the documentation as a Pdf file.
Equity Monaco can perform Monte Carlo simulations on trading system results directly from NeoTicker or on generic text files containing trading results. For example, we can perform a Monte Carlo simulation on a basic moving average crossover system using Microsoft five-minute data over 25 days. To do so, load the Microsoft data into a chart; then add the Backtest EZ indicator onto the five-minute MSFT data. Set the long entry rule to xabove (average (data1, 10), average (data1, 30)), and short entry rule to xbelow (average (data1, 10), average (data1, 30)). Set the Size parameter to 100. Click the Apply button to run the system. The resulting equity curve of the moving average crossover system will be displayed (Figure 11). Right-click on the Backtest EZ indicator legend, and select Trading System>Save Performance File from the popup menu. This saved performance report will be used in Equity Monaco later.
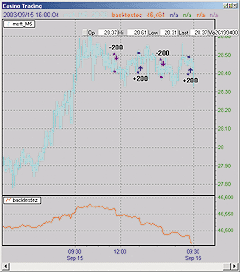
Figure 11: NEOTICKER, MONTE CARLO SIMULATION. Here's a sample NeoTicker chart showing the resulting equity curve for Microsoft when a Monte Carlo simulation is run on a moving average crossover system using NeoTicker's Equity Monaco freeware tool.
Next, start Equity Monaco from the Windows Start Menu and follow
these steps:
- In the settings tab (Figure 12), under Position Data Source, select NeoTicker System Performance File; click on the [...] button and choose the performance file we have generated from within NeoTicker.
Figure 12: NEOTICKER, MONTE CARLO SIMULATION, SETTINGS. Here is the settings tab in NeoTicker from which to select the system performance file.
- Under Basic Settings, set Positions Per Trial to 856 (this is the number of trades each trial run will simulate), Trials to 1,000 (the number of trials), Starting Capital to 50,000, and Minimum Capital to 10,000.
- Click on the Start button to perform the simulation.
- Click on the Profit tab (Figure 13) to view the result. This chart is the return percentage distribution chart plotted in a scientific format. This chart shows that 50% of the time, the moving average crossover system will lose more than $19,000.

Figure 13: NEOTICKER, MONTE CARLO SIMULATION, RESULTS. Click on the Profit tab to view the simulation results of the system. The resulting chart shows the distribution of percentage returns, plotted in a scientific format. This chart shows that 50% of the time, the moving average crossover system will lose more than $19,000.
To plot the equity curves for each trial run in Equity Monaco, simply
enable the option "Enable Equity Curves Plotting" in the
Setting tab. The equity curves will not look exactly the same from different
trials (Figure 14), which is exactly the purpose of using the Monte Carlo
simulation: to be able to visualize what could happen.
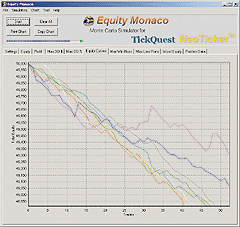
Figure 14: NEOTICKER, MONTE CARLO SIMULATION, EQUITY CURVE. To plot the equity curves for each trial run using the Equity Monaco tool, simply enable the option "Enable Equity Curves Plotting" in the Setting tab. The equity curves will look different with each trial.
Visit the TickQuest website to learn more about Equity Monaco,
which is freeware that can perform Monte Carlo simulations with no programming.
--Kenneth Yuen, TickQuest Inc.GO BACK
www.tickquest.com
![]() Stratagem
Software SMARTrader / COMPUTRAC: Zigzag Trend Indicator
Stratagem
Software SMARTrader / COMPUTRAC: Zigzag Trend Indicator
For this month's tip, we decided to be a bit nostalgic and use the old faithful CompuTrac program for the benefit of any CompuTrac users in the audience. We will present our interpretation of zigzag as compared to another trend-following indicator, MACD.
Zigzag, known as the wave study in CompuTrac, was first introduced to CompuTrac users at CompuTrac's TAG VII conference by Carl Futia.
In the sample chart in Figure 15, zigzag is plotted over a 10-bar period, centered to the bar and plotted 0 (zero) percent above the bar. For clarity, the option exists to position the wave plot above or below the bar.
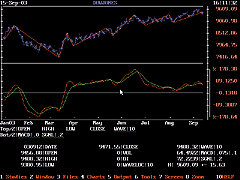
Figure 15: COMPUTRAC, ZIGZAG TREND INDICATOR. Zigzag is plotted over a 10-bar period, centered to the bar and plotted zero percent above the bar. The zigzag (wave study) has indicated a steady uptrend for about five weeks. Knowing the last leg is revisable, note that the MACD has crossed over and is indicating a reversal to a downtrend.
In the example shown in Figure 15, the zigzag (WAVE) has indicated
a steady uptrend for about five weeks. Knowing the last leg is revisable,
note that the MACD has crossed over and is indicating a reversal to a downtrend.
--Jim Ritter, Stratagem Software InternationalGO BACK
504 885-7353, Stratagem1@aol.com
www.stratagem1.com
All rights reserved. © Copyright 2003, Technical Analysis, Inc.
Return to November 2003 Contents