Q&A
Explore Your Options
| Got a question about options? Tom Gentile is the chief options strategist at Optionetics (www.optionetics.com), an education and publishing firm dedicated to teaching investors how to minimize their risk while maximizing profits using options. To submit a question, post it on the STOCKS & COMMODITIES website Message-Boards. Answers will be posted there, and selected questions will appear in future issues of S&C. | 
Tom Gentile of Optionetics |
AULD LANG VIX
What happened to the "old" VIX? Can I still use that index to measure volatility?
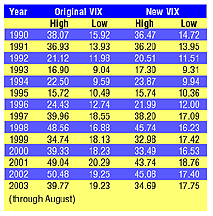
Absolutely. The old VIX (the CBOE's market volatility index) used a series of options from the Standard & Poor's 100 index as a gauge of market volatility. Today, the symbol for the volatility index on the S&P 100 is $VXO, but I recommend adopting the "new" VIX ($VIX) as your primary market volatility indicator. The folks at the CBOE finally heard the cries of the options traders and market speculators and changed the formula used to calculate the VIX. Prior to the change, the index itself and the options it was using didn't truly reflect market sentiment and volatility. The new VIX uses the S&P 500 and the underlying options to measure sentiment and volatility. The old VIX used only at-the-money options to calculate the average implied volatility of the series, whereas the new VIX uses at-the-money and out-of-the-money options. As a result, were you to look at an older chart of the VIX, you'd see the volatility was higher on average than today's VIX (see Figure 1).

Figure 1: CBOE volatility index. The "old" VIX had higher volatility, on average, than the new one.
Although the VIX has changed, the mantra among traders remains the same: "When the VIX is low, it's time to go; when the VIX is high, it's time to buy." The new VIX relative highs and lows vary only by a point or two from the old one, so you can pretty much continue to use your old benchmarks as signals to go short or long. Sometime in the near future, we will be able to trade options on the new VIX. I for one look forward to some of the opportunities that will bring!
WASN'T VERY FUZZY, WAS HE?
If I buy back the short position in my bear spread, doesn't that mean I'm "naked"?
No, it doesn't. Anytime you buy back the short position in a spread, and all you are left with is long positions in the trade, then you are not "naked." Traders often confuse the term with holding a single long position. Instead, "naked" means to hold an open short position without the protection of a hedge (long or short stock or future, or long option) that defines the maximum risk of that short.
If you're naked a put, then you may be obliged to have the stock "put" to you at an unfavorable strike price. There is not too much risk in this if you're short a 5 strike and the stock goes to zero; however, many people have too much confidence that high fliers will always remain high fliers. Thus, they will sell naked puts on stocks over $100 -- that's a long way to zero. Should you own a put that is $5 to $10 beneath the short strike, then your maximum risk is the difference between the two strikes.
Conversely, if you are naked a call, technically the sky's the limit for how high the stock can go. If you are assigned on the short call, you are obligated to deliver the shares at the strike price, which means you have to go out on the open market and buy the stock at its current price so that you actually have some shares to deliver.
PUT/CALL RATIO
What is a put/call ratio?
A put/call ratio is a market sentiment indicator that denotes the volume of puts traded divided by the volume of calls traded for that day. You can use put/call ratios to give you an idea of imminent moves in a stock, index, or futures contract that has options traded on it. Since most traders, on average, are bullish, rarely does an equity's or index's put/call ratio exceed 1/1. This would indicate excessive bearishness and a trader could look for an imminent reversal in the underlying. The CBOE has a daily total put/call ratio for equities that is very helpful for getting an idea of the overall bullishness or bearishness of the market. The reason it can be used as a market indicator is that this put/call ratio actually calculates the total number of puts and calls traded on all of the combined equities on its own exchange. Since the CBOE is one of the largest of the five options exchanges, the number is a great barometer of market sentiment.
Return to December 2003 Contents
Originally published in the December 2003 issue of Technical
Analysis of STOCKS & COMMODITIES magazine.
All rights reserved. © Copyright 2003, Technical Analysis, Inc.