TRADING TECHNIQUES
Low-Lag Indicator, Short-Term Reversals
Trade The Price Swings
by Barbara Star, Ph.D.
You can use this method to identify short-term price reversals.
In the futures markets, timing is critical. The ability to recognize price shifts quickly is not only a desirable trait; it is a crucial trading skill. Traders need technical indicators that can keep pace with market conditions and alert them to possible changes. Here's a low-lag indicator that identifies short-term price reversals and suggests a few trading strategies.
REDUCE LAG TIME
Traders typically rely on moving averages to help identify price direction. But short-term traders often find that moving averages lag too much. Instead, they can turn to the linear regression indicator, which offers many of the same benefits as a moving average, but with the added advantage of reduced lag time.

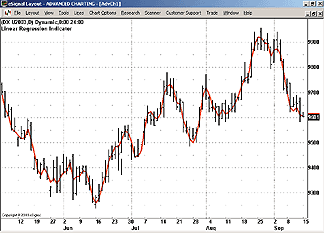
Figure 1: The US Dollar Index with the Linear Regression Indicator. The red five-unit linear regression indicator plotted on price is very responsive to short-term price shifts, as illustrated in this chart of the September 2003 dollar index contract.
The linear regression indicator is actually the endpoint of a type of trendline. It computes price direction based on a statistical method known as the least-squares fit, which plots a straight line though the price datapoints rather than averaging the datapoints. As the direction of the market changes, the direction of the endpoint of the straight trendline changes sooner than would a moving average of the price points.
...Continued in the December 2003 issue of Technical Analysis of STOCKS & COMMODITIES
Excerpted from an article originally published in the December 2003 issue of Technical Analysis of STOCKS & COMMODITIES magazine. All rights reserved. © Copyright 2003, Technical Analysis, Inc.
Return to December 2003 Contents