December 2003
TRADERS' TIPS
You can copy these formulas and programs for easy use in your spreadsheet or analysis software. Simply "select" the desired text by highlighting as you would in any word processing program, then use your standard key command for copy or choose "copy" from the browser menu. The copied text can then be "pasted" into any open spreadsheet or other software by selecting an insertion point and executing a paste command. By toggling back and forth between an application window and the open Web page, data can be transferred with ease.
This month's tips include formulas and programs for:
TRADESTATION: Divergence Bias
TRADESTATION: Trade The Price Swings
METASTOCK: TRADE THE PRICE SWINGS
eSIGNAL: DIVERGENCE BIAS
AMIBROKER: DIVERGENCE BIAS
AMIBROKER: TRADE THE PRICE SWINGS
NEUROSHELL TRADER: DIVERGENCE BIAS
NEUROSHELL TRADER: PRICE SWINGS
TRADINGSOLUTIONS: DIVERGENCE BIAS
TRADINGSOLUTIONS: TRADE THE PRICE SWINGS
NEOTICKER: DIVERGENCE BIAS
NEOTICKER: TRADE THE PRICE SWINGS
WEALTH-LAB: DIVERGENCE BIAS
WEALTH-LAB: TRADE THE PRICE SWINGS
PROPHET.NET: TRADE THE PRICE SWINGS
INVESTOR/RT: TRADE THE PRICE SWINGS
TECHNIFILTER PLUS: TRADE THE PRICE SWINGS
STOCKWIZ: DIVERGENCE BIAS
STOCKWIZ: TRADE THE PRICE SWINGS
or return to December 2003 Contents
![]() TRADESTATION: DIVERGENCE BIAS
TRADESTATION: DIVERGENCE BIAS
Giorgos Siligardos' article "Divergence Bias" describes alternative methods of calculating two of the most popular trend indicators, momentum and moving average convergence/divergence (MACD). The two indicators from his article are presented here as fractional momentum and fractional MACD. The code for both indicators is provided here. All four indicators are shown in Figure 1. In addition, the built-in zig-zag% indicator is used on the price plot to show an idealized trading pattern.

FIGURE 1: TRADESTATION, DIVERGENCE BIAS. All four indicators are shown here: two from Giorgos Siligardos' article "Divergence Bias" (fractional momentum and fractional MACD) and the two traditional indicators on which Star's indicators are based (momentum and the traditional MACD). In addition, the built-in zig-zag% indicator is used on the price plot to show an idealized trading pattern.
To assist traders interested in comparing the indicators, we have created a "Fractional mom-MACD" strategy. This strategy includes all four indicators, allowing the trader to pick any entry-exit combination of the four (simple momentum, simple MACD, fractional momentum, fractional MACD). It is even possible to use the optimization feature of TradeStation to test all possible combinations.
The strategy is configured by setting the input parameters. The usual parameters for momentum and MACD calculations are used. In addition, four kinds of long and four kinds of short triggers available. Set the activation input to trigger the kind of indicator you wish to use. Use an input value of "1" to activate the trigger, and a zero to deactivate it.
To test stop-and-reverse strategies, activate one or more of the triggers for both a long and a short trade. Alternatively, to go long only, activate a long and short trigger, then format your strategy to use the short signal as an "exit only." (This feature is available in the "Strategy format" dialog box.) The same thing can be done in the short-only case. In the short-only case, activate the long trigger, but reformat it to "exit only."
Finally, if you wish to backtest using stops, the built-in strategy "_Stops and Targets" can be inserted. If you add this to your chart, it will provide a choice of fixed and trailing exits.
Indicator: FracMom
inputs:
 Period( 14 ) ;
Plot1( Close / Close[Period], "FracMom" ) ;
Plot2( 1, "1" ) ;
Indicator: FracMACD
inputs:
 ShortPeriod( 9 ),
 LongPeriod( 26 ) ;
Plot1( Average( Close, ShortPeriod )
 / Average( Close, LongPeriod ), "FracMACD" ) ;
Plot2( 1, "1" ) ;
Strategy: FracMom-MACD
inputs:
 Price( Close ),
 MomentumLength( 12 ),
 ShortMACDLength( 12 ),
 LongMACDLength( 26 ),
 MACDSmoothing( 9 ),
 SimpleMomentumLong ( 1 ),
 FracMomLong( 0 ),
 SimpleMACDLong( 0 ),
 FracMACDLong( 0 ),
 SimpleMomentumShort( 1 ),
 FracMomShort( 0 ),
 SimpleMACDShort( 0 ),
 FracMACDShort( 0 ) ;
variables:
 Mom( 0 ),
 FracMomentum( 0 ),
 FracMACD( 0 ),
 SmoothFracMACD( 0 ),
 MyMACD( 0 ),
 MACDAvg( 0 ) ;
{Calculations}
Mom = Momentum( Price, MomentumLength ) ;
FracMomentum = Price / Price[ MomentumLength ] ;
FracMACD = Average( Price, ShortMACDLength )
 / Average( Price, LongMACDLength ) ;
SmoothFracMACD = Average( FracMACD, MACDSmoothing ) ;
MyMACD = MACD( Close, ShortMACDLength, LongMACDLength );
MACDAvg = XAverage( MyMACD, MACDSmoothing ) ;
{Long Entries}
{Simple Momentum}
if Mom > 0 and Mom >= Mom[1]
 and SimpleMomentumLong = 1
then
 Buy ( "SimMomLLE" ) next bar at High + 1 point stop;
{Fractional Momentum}
if FracMomentum > 1 and FracMomentum >= FracMomentum[1]
 and FracMomLong = 1
then
 Buy ( "FracMomLE" ) next bar at High + 1 point stop;
if CurrentBar > 2 and MyMACD crosses over MACDAvg
 and SimpleMACDLong = 1
then
{ CB > 2 check used to avoid spurious cross confirmation
 at CB = 2 at CB = 1, MyMACD and MACDAvg
 will be the same }
 Buy ( "SimMacdLE" ) next bar at market ;
if CurrentBar > 2
 and FracMACD crosses over SmoothFracMACD
 and FracMACDLong = 1
then
{ CB > 2 check used to avoid spurious cross confirmation
 at CB = 2 at CB = 1 }
 Buy ( "FracMacdLe" ) next bar at market ;
{Short Entries}
{Simple Momentum}
if Mom < 0 and Mom <= Mom[1]
 and SimpleMomentumShort = 1
then
 SellShort ( "SimMomSE" ) next bar at High + 1 point stop ;
{Fractional Momentum}
if FracMomentum < 1 and FracMomentum <= FracMomentum[1]
 and FracMomShort = 1
then
 SellShort ( "FracMomSE" ) next bar at High + 1 point stop ;
if CurrentBar > 2 and MyMACD crosses under MACDAvg
 and SimpleMACDShort = 1
then
{ CB > 2 check used to avoid spurious cross confirmation
(at CB = 1, MyMACD and MACDAvg will be the same) }
 SellShort ( "SimMacdSE" ) next bar at market ;
if CurrentBar > 2
 and FracMACD crosses under SmoothFracMACD
 and FracMACDShort = 1
then
{CB > 2 check used to avoid spurious cross confirmation}
 SellShort ( "FracMacdSE" ) next bar at market ;
An Eld file will be available for download from the EasyLanguage
Exchange on www.tradestationworld.com. Look for the file "Fractional
Momentum-Macd.Eld."
--Mark MillsGO BACK
MarkM@TSSEC at www.TradeStationWorld.com
EasyLanguage Questions Forums
TradeStation Securities, Inc.
A subsidiary of TradeStation Group, Inc.
![]() TRADESTATION: TRADE THE PRICE SWINGS
TRADESTATION: TRADE THE PRICE SWINGS
Barbara Star's article "Trade The Price Swings" in this issue describes the use of linear regression calculations for trend identification. The five-period linear regression indicator she describes can be plotted by TradeStation using the built-in linear reg curve indicator. The linear reg curve indicator has three inputs: price, length, and displace. To plot Star's five-period linear regression indicator, use "close" as the price input, "5" as the length input, and zero as the displace input.
Star then describes a binary trend indicator, the linear regression reversal. This indicator changes from positive to negative in value whenever the difference between one bar's linear regression value and the previous linear regression value reverses direction when compared to the previous difference. Star's indicator is presented here in EasyLanguage as linear reg curve dir.

FIGURE 2: TRADESTATION, TREND REVERSAL SYSTEM. The linear regression reversal indicator changes from positive to negative in value whenever the difference between one barís linear regression value and the previous linear regression value reverses direction when compared to the previous difference. These linear regression calculations are used for trend identification.
To allow you to test the Star's trend reversal system, the
linear reg curve dir indicator has been converted into a strategy named
"Lin Reg Strat."
Indicator: LinReg Curve Dir:
inputs:
 Price( Close ),
 Length( 5 ) ;
variables:
 LRValue( 0 ) ;
LRValue = LinearRegValue( Price, Length, 0 ) ;
if LRValue > LRValue[1]  then
 Plot1( 1 )
else if LRValue < LRValue[1] then
 Plot1( -1 )
else
 Plot1( 0 ) ;
Strategy: Linear Reg Curve
inputs:
 Price( Close ),
 Length( 5 ),
 StopLossPct( 3 ) ;
variables:
 StopLossAmt( 0 ),
 LRValue( 0 ) ;
LRValue = LinearRegValue( Price, Length, 0 ) ;
if LRValue crosses over LRValue[1] then
 begin
 Buy next bar at High stop ;
 StopLossAmt = High * StopLossPct / 100 ;
 end
else if LRValue crosses under LRValue[1] then
 begin
 SellShort next bar at Low stop ;
 StopLossAmt = Low * StopLossPct / 100 ;
 end ;
SetStopShare ;
SetStopLoss( StopLossAmt * 2 * BigPointValue ) ;
SetDollarTrailing( StopLossAmt * BigPointValue ) ;
An ELD file will be available for download from the EasyLanguage
Exchange on www.tradestationworld.com. Look for the file "Linear
Regression System.Eld."
--Mark MillsGO BACK
MarkM@TSSEC at www.TradeStationWorld.com
EasyLanguage Questions Forums
TradeStation Securities, Inc.
A subsidiary of TradeStation Group, Inc.
![]() METASTOCK: TRADE THE PRICE SWINGS
METASTOCK: TRADE THE PRICE SWINGS
Barbara Star's article "Trade The Price Swings" uses a five-period linear regression indicator as the basis for buy and sell signals. The MetaStock formulas for the reversal indicator and the system based on it are given here.
To enter this indicator into MetaStock, click on Tools | Indicator Builder.
Click "New" and type the name of the formula. Then click
in the larger window and type in the actual formula.
Name: Linear Regression Reversal Indicator
Formula:
If( LinearReg(C,5)>(Ref( LinearReg(C,5),-1)),+1,
If( LinearReg(C,5)<(Ref(LinearReg(C,5),-1)),-1,0))
Here is the system test to go with it. To add this to MetaStock,
open the system tester. Click "New" and enter the name of
the test. Then enter the following formula in the respective areas. Please
note: MetaStock 8.0 will have a slightly different name for these areas,
but the formulas are the same. In addition, the article suggested a trailing
stop for the exit conditions, but did not recommend how tight to set the
stop. Therefore, this tip makes no recommendation.
After entering the formulas, click on "stops" and enable
the trailing stop for both long and short positions. Set the trailing stop
at a value you are comfortable with and click OK. The system test is now
ready to use.
Name: Linear Regression Reversal
Enter Long:
LRR:=If( LinearReg(C,5)>(Ref( LinearReg(C,5),-1)),+1, If( LinearReg(C,5)<(Ref(LinearReg(C,5),-1)),-1,0));
Ref(LRR,-1)=1 AND C> Ref(C,-1)
Enter Short:
LRR:=If( LinearReg(C,5)>(Ref( LinearReg(C,5),-1)),+1, If( LinearReg(C,5)<(Ref(LinearReg(C,5),-1)),-1,0));
Ref(LRR,-1)=-1 AND C< Ref(C,-1)
--William Golson
Equis International
![]() eSIGNAL: DIVERGENCE BIAS
eSIGNAL: DIVERGENCE BIAS
The following eSignal code plots the fracMom indicator and the I(n)
indicator (Figure 3) as well as the fracMacd indicator and the J(n) indicator
(Figure 4).

Figure 3: eSignal, fractal momentum. Here's a sample eSignal chart plotting the fracMom indicator and the I(n) indicator.

Figure 4: eSignal, fractal MACD. Here's a sample eSignal chart plotting the fracMacd indicator and the J(n) indicator.
/*******************************************************************
Description : This Study Plots fracMACD Indicator
Provided By : TS Support, LLC for eSignal
********************************************************************/
function preMain(){
    setStudyTitle("fracMACD");
    setCursorLabelName("fracMACD",0);
    setDefaultBarFgColor(Color.red,0);
    setComputeOnClose();
    setDefaultBarThickness(2);
}
var FastEMA = null;
var SlowEMA = null;
function main(SlowLen,FastLen){
 if(SlowLen == null)
  SlowLen = 20;
 if(FastLen == null)
  FastLen = 10;
 if(SlowEMA == null)
   SlowEMA = new MAStudy(SlowLen, 0, "Close", MAStudy.EXPONENTIAL);
 if(FastEMA == null)
   FastEMA = new MAStudy(FastLen, 0, "Close", MAStudy.EXPONENTIAL);

 var fracMACD = 0;
 fracMACD =  SlowEMA.getValue(MAStudy.MA) / FastEMA.getValue(MAStudy.MA) ;
 return fracMACD;
}
/*******************************************************************
Description : This Study Plots fracMom Indicator
Provided By : TS Support, LLC for eSignal
********************************************************************/
function preMain(){
    setStudyTitle("fracMom");
    setCursorLabelName("fracMom",0);
    setDefaultBarFgColor(Color.red,0);
    setComputeOnClose();
    setDefaultBarThickness(2);
}
function main(Length){
 if(Length == null)
  Length = 10;
 var fracMom = 0;
 fracMom = close() / close(-Length);
 return fracMom;
}
/*******************************************************************
Description : This Study Plots I(n) Indicator
Provided By : TS Support, LLC for eSignal
********************************************************************/
function preMain(){
    setStudyTitle("I(n)");
    setCursorLabelName("I(n)",0);
    setDefaultBarFgColor(Color.blue,0);
    setComputeOnClose();
    setDefaultBarThickness(2);
}
function main(Length){
 if(Length == null)
  Length = 10;
 var I = 0;
 I =  100 * (close() - close(-Length)) / close(-Length);
 return I;
}
/*******************************************************************
Description : This Study Plots J(n) Indicator
Provided By : TS Support, LLC for eSignal
********************************************************************/
function preMain(){
    setStudyTitle("J(n)");
    setCursorLabelName("J(n)",0);
    setDefaultBarFgColor(Color.lime,0);
    setComputeOnClose();
    setDefaultBarThickness(2);
}
function main(Length){
 if(Length == null)
  Length = 10;
 var J = 0;
 J =  100 * (close() - close(-Length)) / close();
 return J;
}
--eSignal
![]() AMIBROKER: DIVERGENCE BIAS
AMIBROKER: DIVERGENCE BIAS
In "Divergence Bias," Giorgos Siligardos discusses the
differences between momentum indicators expressed as the difference and
fraction of current price and price n periods ago. In addition to that,
the author suggests an alternative way of calculating the classic MACD
indicator. Listing 1 shows how simply all these indicators can be coded
into the AmiBroker Formula Language.
LISTING 1
// N-bar momentum
function Mom( n )
{
return C - Ref( C, -n );
}
// N-bar fractional momentum
function fracMom( n )
{
return C / Ref( C, -n );
}
// S, L- bar fractional MACD
function fracMACD( s, l )
{
return EMA( C, s ) / EMA( C, l );
}
--Tomasz Janeczko, AmiBroker.comGO BACK
www.amibroker.com
![]() AMIBROKER: TRADE THE PRICE SWINGS
AMIBROKER: TRADE THE PRICE SWINGS
In "Trade The Price Swings," Barbara Star presents a simple application of classic linear regression. The technique involves detecting the direction of the end point of the linear regression trendline. Since linear regression is a built-in function in the AmiBroker Formula Language, it is very easy and straightforward to implement the linear regression reversal indicator presented in the article.
Listing 1 shows ready-to-use code that can be applied in the Indicator
Builder. A sample chart is shown in Figure 5.

Figure 5: AmiBroker, linear regression. This sample screenshot shows the daily December 2003 euro currency bar chart with the five-day linear regression line (red) and a 13-bar simple moving average in the upper pane. The lower pane shows the five-bar linear regression reversal indicator as presented in Barbara Star's article.
LISTING 1
function LinearRegReversal( array, period )
{
  Lr = LinearReg( array, period );
    return IIf( Lr >= Ref( Lr, -1 ), 1, -1 );
}
Plot( LinearRegReversal( C, 5 ), "LR Reversal", colorBlue);
PlotGrid(1);
PlotGrid(-1);
--Tomasz Janeczko, AmiBroker.com
https://www.amibroker.com
![]() NEUROSHELL TRADER: DIVERGENCE BIAS
NEUROSHELL TRADER: DIVERGENCE BIAS
Giorgos Siligardos provides us with a method of analyzing divergence
bias using several indicators that are either included in the NeuroShell
Trader or can be recreated by combining a few of the 800 technical indicators.
Below is the list of indicators that Siligardos uses:
Siligardos NeuroShell Trader  NeuroShell Trader
article indicator category
Mom Momentum (Mom) Change
fracMom Rate of Change (ROC) Change
MACD Avg1 ? Avg2 Advanced simple
  moving averages
fracMACD Avg1 / Avg2 Ratio Advanced simple
  moving averages
By using these indicators, you can see how Siligardos' analysis
can be demonstrated in NeuroShell Trader. Examples can be seen in Figures
6 and 7.

Figure 6: NeuroShell Trader, momentum. This sample NeuroShell Trader chart displays the momentum indicators described by Giorgos Siligardos.

Figure 7: NeuroShell Trader, MACD. This sample NeuroShell Trader chart displays the MACD indicators described by Giorgos Siligardos.
In addition, Siligardos refers to correlation between the indicators.
The indicator that he refers to is named the coefficient of correlation
(LinXYReg r) in NeuroShell Trader. This indicator is located in the regression
category.
To insert any of the indicators referred to by Siligardos:
1. Select "New Indicator ..." from the Insert menu.
2. Select the appropriate category.
3. Select the desired indicator.
4. Select any of the parameters that you wish to modify.
5. Press the Set Parameter button and set the parameter to the desired value.
6. Select the Finished button.
You can easily insert any of these indicators or combine them with
any of our 800 built-in indicators into a chart, prediction, or trading
strategy. In addition, if you decide to use this indicator in a prediction
or trading strategy, the coefficients may be optimized by the genetic algorithm
built into NeuroShell Trader Professional.
Users of NeuroShell Trader can go to the STOCKS & COMMODITIES section of the NeuroShell Trader free technical support website to download a copy of this or any previous Traders' Tips.
For more information on the NeuroShell Trader, visit www.NeuroShell.com.
--Marge Sherald, Ward Systems Group, Inc.GO BACK
301 662-7950, sales@wardsystems.com
www.neuroshell.com
![]() NEUROSHELL TRADER: PRICE SWINGS
NEUROSHELL TRADER: PRICE SWINGS
Barbara Star's linear regression reversal indicator (Figure 8) can be easily implemented in NeuroShell Trader by combining a few of NeuroShell Trader's 800 indicators. To implement the indicator, select "New Indicator ..." from the Insert menu and use the Indicator Wizard to create the following indicator:

Figure 8: NeuroShell Trader, linear regression reversal indicator. Here's a sample NeuroShell linear regression reversal chart.
Linear regression reversal indicator:
    IfThenElseIfThen ( A>B(LinTimeRegSlope(Close,5),0), 1,
         A<B(LinTimeRegSlope(Close,5),0), -1, 0 )
To recreate the linear regression reversal indicator trading system
described in the article, select "New Trading Strategy ..."
from the Insert menu and enter the following long and short entry conditions
in the appropriate locations of the Trading Strategy Wizard.
Generate a buy long MARKET order if ALL of the following are true:
        CrossAbove ( Lag ( LinTimeRegSlope(Close,5), 1), 0 )
        A>B ( Close, Lag ( High, 1 ) )
Generate a long trailing stop order at the following price:
        TrailPrice% ( Trading Strategy, 5 )
Generate a sell long MARKET order if ONE of the following conditions is true:
        CrossBelow ( Lag ( LinTimeRegSlope(Close,5), 1), 0 )
        A<B ( Close, Lag ( Low, 1 ) )
Generate a short trailing stop order at the following price:
        TrailPrice% ( Trading Strategy, 5 )
If you have NeuroShell Trader Professional, you can also choose
whether the system parameters should be optimized. After backtesting the
trading strategy, use the "Detailed Analysis ..." button
to view the backtest and trade-by-trade statistics for the linear regression
reversal indicator system.
Users of NeuroShell Trader can go to the STOCKS & COMMODITIES section of the NeuroShell Trader free technical support website to download a sample chart that includes the linear regression reversal indicator and trading system.
--Marge Sherald, Ward Systems Group, Inc
301 662-7950, email sales@wardsystems.com
https://www.neuroshell.com
![]() TRADINGSOLUTIONS: DIVERGENCE BIAS
TRADINGSOLUTIONS: DIVERGENCE BIAS
In his article "Divergence Bias" in this issue, Giorgos Siligardos compares and contrasts the usages of several different momentum and MACD-type indicators.
Most of these indicators are built into TradingSolutions, but use a different name.
The "momentum" indicator defined in the article is called "change in value" in TradingSolutions. The "momentum as a percentage" is called "percent change in value" in TradingSolutions. The fractional momentum is called "momentum" and is multiplied by 100 for easier charting. This multiplication does not affect the divergence usage.
The MACD indicator defined in the article is called "value oscillator" in TradingSolutions. An MACD indicator is also available in TradingSolutions, but it is restricted to its traditional moving average lengths. The value oscillator also has a parameter that allows it to be represented as a raw value or a percentage.
The one function that is not built into TradingSolutions is the division
of two moving averages, which is referred to as the "fractional
MACD" in Siligardos' article. It can be defined as follows:
Name: Fractional MACD
Short Name: fracMACD
Inputs: Data, Short Period, Long Period
Formula:
Div (MA (Data, Short Period), MA (Data, Long Period))
This function is available in a function file that can be downloaded
from the TradingSolutions website (www.tradingsolutions.com) in the Solution
Library section.
--Gary Geniesse
NeuroDimension, Inc.
800 634-3327, 352 377-5144
https://www.tradingsolutions.com
![]() TRADINGSOLUTIONS: TRADE THE PRICE SWINGS
TRADINGSOLUTIONS: TRADE THE PRICE SWINGS
In "Trade The Price Swings," Barbara Star discusses the usage of the linear regression indicator in place of using a standard moving average. The linear regression indicator is built into TradingSolutions. Her additional calculation on it, called the linear regression reversal indicator, can be coded as follows in TradingSolutions (Figure 9):

Figure 9: TradingSolutions, linear regression reversal indicator. Here is the linear regression reversal indicator plotted in TradingSolutions.Name: Linear Regression Reversal Indicator Short Name: LinRegReverse Inputs: Data, Period, Formula: If (GE (Change (LRI (Data,Period),1),0),1,-1)
This function is available in a downloadable file at the TradingSolutions
website (www.tradingsolutions.com) in the Solution Library section.
--Gary Geniesse
NeuroDimension, Inc.
800 634-3327, 352 377-5144
https://www.tradingsolutions.com
![]() NEOTICKER: DIVERGENCE BIAS
NEOTICKER: DIVERGENCE BIAS
Implementing in NeoTicker the concept presented in "Divergence Bias" by Giorgos Siligardos requires the use of seven different indicators. Two are built-in indicators: momentum and MACD. Five can be recreated with formula language indicators: momentum fractional, momentum percentage I(n), momentum percentage J(n), MACD fractional, and MACD percentage.
To construct a Dow Jones daily chart with all three different momentum
indicators, three custom formula language indicators are required. First,
to create the momentum fractional indicator, add a new formula indicator
called fracMom with one integer parameter Period (Listing 1). To create
the momentum percentage I(n) indicator, add a formula indicator called
MomIn with one integer parameter Period (Listing 2). Finally, to create
the momentum percentage J(n) indicator, add a formula indicator called
MomJn with one integer parameter Period (Listing 3). After all the indicators
are created, the Dow Jones chart can be constructed by adding the three
indicators to the daily Dow Jones data (Figure 10).
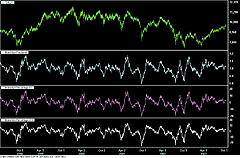
Figure 10: NeoTicker, momentum indicators. Here's a daily Dow Jones chart with the three indicators momentum fractional indicator, the momentum percentage I(n) indicator, and the momentum percentage J(n) indicator.
To construct a daily IBM chart with MACD and the MACD fractional
indicator, you need to create one custom formula language indicator. To
recreate the MACD fractional indicator, add a new formula indicator called
fracMacd. FracMacd requires three three parameters; slow period, fast period,
and one string parameter type (Listing 4). Add the fracMacd indicator and
the built-in indicator qc_Macd to the chart. The result is the Ibm daily
chart presented in the article (Figure 11).
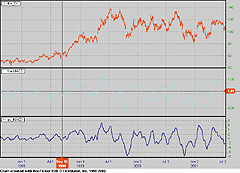
Figure 11: NeoTicker, MACD fractional indicator. Here's a daily IBM chart with the MACD and the MACD fractional indicator.
The article also mentions an indicator named MACD percentage, although
it is not presented in any of the charts. This indicator can also be recreated
with formula language. To do so, add an indicator called Macdper with two
integer parameters, fast period and slow period (Listing 5).
LISTING 1
Pn := data1(param1-1);
plot1 := if(Pn > 0, data1/Pn, 0);
success1 := if(Pn > 0, 1, 0);
LISTING 2
Pn := data1(param1-1);
plot1 := if(Pn > 0, ((data1-Pn)/Pn)*100, 0);
success1 := if(Pn > 0, 1, 0);
LISTING 3
Pn := data1(param1-1);
plot1 := if(data1 > 0, ((data1-Pn)/data1)*100, 0);
success1 := if(data1 > 0, 1, 0);
LISTING 4
slowMA := qc_xaverage(data1,param2);
fastMA := qc_xaverage(data1,param1);
plot1 := if(slowMA > 0, fastMA/slowMA, 0);
success := if (slowMA > 0, 1, 0);
LISTING 5
fastMA := qc_xaverage(0,data1,param1);
slowMA := qc_xaverage(0,data1,param2);
plot1 := if(slowMA > 0, ((fastMA-slowMA)/slowMA)*100, 0);
success1 := if(slowMA > 0, 1, 0);
Downloadable versions of these indicators are available from TickQuest
website.
--Kenneth YuenGO BACK
www.tickquest.com
![]() NEOTICKER: TRADE THE PRICE SWINGS
NEOTICKER: TRADE THE PRICE SWINGS
The concept presented in "Trade The Price Swings" by Barbara Star can be replicated in NeoTicker with built-in indicator linear regression value and the custom formula indictor linregrev.
First, the linear regression indicator is the same as NeoTicker's built-in indicator linear regression value. To recreate in NeoTicker the US dollar index chart in the article, load the daily chart of DX and add the linear regression value indicator to the chart with period "5" and projection "0" (Figure 12).
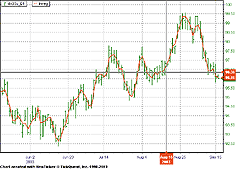
Figure 12: NeoTicker, linear regression. Here's the US dollar index (DX) with the linear regression value indicator.
For the linear regression reversal indicator, add a new formula language
indicator called linregrev with one integer parameter called Period (Listing
1). The linregrev indicator will plot a line in a new pane with either
a 1 or -1 value (Figure 13).
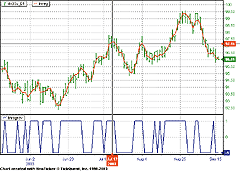
Figure 13: NeoTicker, reversal indicator. Here's the linear regression reversal indicator. The linregrev indicator will plot a line in a new pane with a value of either 1 or -1.
LISTING 1
mylinreg := linreg (data1, param1, 0);
plot1 := if (mylinreg > mylinreg (1), 1, -1);
A downloadable version of the linear regression reversal indicator is available from TickQuest website.
--Kenneth Yuen, TickQuest Inc.GO BACK
www.tickquest.com
![]() WEALTH-LAB: DIVERGENCE BIAS
WEALTH-LAB: DIVERGENCE BIAS
The following Wealth-Lab script plots the momentum and fractional momentum indicators on a chart. It also plots the 100-bar correlation between the two indicators.
We take this a step further by programming some automated divergence detection. Divergences are detected by examining the corresponding peaks and troughs between price and the two indicators. The script contains three constants that you can change to tune the sensitivity of the peak/trough detection:
    const PriceReversal = 7.0;
Controls how much percentage move in price is required to
qualify a peak/trough (default 7%)
    const MReversal = 2.0;
Controls how much of an absolute move in Momentum is required
to qualify a peak/trough (default 2). We only check for top
divergences between price and Momentum.
    const MFReversal = 8.0;
Controls how much of an absolute move in tje fractional
momentum indicator is required to qualify as a peak/trough
(default 8). We only checked for bottom divergences between
price and fractional momentum.
We check for a divergence when peaks and troughs of the price are
within four bars of the indicator peak/troughs. At that point, divergence
lines are drawn programmatically by the script (Figure 14). In addition,
the background pane of the diverging indicator is colored red during the
period of the divergence.
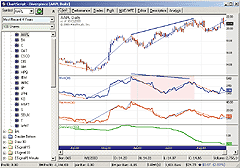
Figure 14: Wealth-Lab, divergence bias. The script detects a top divergence between price and momentum in Apple Computer stock. Divergence lines are drawn programmatically by the script.
This script requires a new study that we created specifically for
this article. The "ZigZagSer" study plots zigzag lines for
any price or indicator, using the specified reversal amount. Save the following
script in the Wealth-Lab Developer "Studies" folder, and
name it "ZigZagSer."
You can now run the following Wealth-Lab script to perform the divergence analysis on any stock or future:procedure ZigZagSer( Series, Pane: integer; Reversal: float ); begin var LastPeak, LastTrough: float; var Bar, LastPeakBar, LastTroughBar: integer; LastPeak := 0.0; LastTrough := 0.0; LastPeakBar := 0; LastTroughBar := 0; for Bar := 0 to BarCount() - 1 do begin if Peak( Bar, Series, Reversal ) <> LastPeak then begin LastPeak := Peak( Bar, Series, Reversal ); LastPeakBar := PeakBar( Bar, Series, Reversal ); DrawLine( LastTroughBar, LastTrough, LastPeakBar, LastPeak, Pane, 009, #Thin ); end; if Trough( Bar, Series, Reversal ) <> LastTrough then begin LastTrough := Trough( Bar, Series, Reversal ); LastTroughBar := TroughBar( Bar, Series, Reversal ); DrawLine( LastPeakBar, LastPeak, LastTroughBar, LastTrough, Pane, 900, #Thin ); end; end; end;
GO BACK{$I 'ZigZagSer'} { Script variables } var Bar, M, MF, MPane, MFPane, C, CPane, n: integer; var pb1, pb2, mb1, mb2, lastDrawn: integer; var p1, p2, m1, m2: float; { Function to return the sign of a number } function Sign( x: float ): integer; begin if x >= 0 then Result := 1 else Result := -1; end; { Momentum Analysis Period } const Period = 30; { Reversal values to detect peaks/troughs } const PriceReversal = 7.0; const MReversal = 2.0; const MFReversal = 8.0; { Obtain Mom and fracMom, and get correlation } M := MomentumSeries( #Close, Period ); MF := ROCSeries( #Close, Period ); C := CreateSeries; for Bar := 100 to BarCount - 1 do @C[Bar] := Correlation( M, MF, Bar - 99, Bar ); { Plot them all } MPane := CreatePane( 100, false, true ); MFPane := CreatePane( 100, false, true ); CPane := CreatePane( 100, false, true ); HideVolume; PlotSeriesLabel( M, MPane, #Blue, #Thick, 'Mom(30)' ); PlotSeriesLabel( MF, MFPane, #Red, #Thick, 'fracMom(30)' ); PlotSeriesLabel( C, CPane, #Green, #Thick, 'Correlation(100)' ); { Plot Zig-Zags on Price and Momentum indicators } ZigZagSer( #Close, 0, 7 ); SetPeakTroughMode( #AsPoint ); ZigZagSer( M, MPane, 2 ); ZigZagSer( MF, MFPane, 8 ); { Perform Divergence Analysis } for Bar := 100 to BarCount - 1 do begin { Divergence between Price and Mom - tops } SetPeakTroughMode( #AsPercent ); pb1 := PeakBar( Bar, #Close, 7 ); pb2 := PeakBar( pb1, #Close, 7 ); p1 := Peak( Bar, #Close, 7 ); p2 := Peak( pb1, #Close, 7 ); SetPeakTroughMode( #AsPoint ); mb1 := PeakBar( Bar, M, 2 ); mb2 := PeakBar( mb1, M, 2 ); m1 := Peak( Bar, M, 2 ); m2 := Peak( mb1, M, 2 ); if ( Abs( pb1 - mb1 ) < 4 ) and ( Abs( pb2 - mb2 ) < 4 ) then begin if Sign( p1 - p2 ) <> Sign( m1 - m2 ) then begin if pb1 <> lastDrawn then begin lastDrawn := pb1; DrawLine( pb1, p1 * 1.01, pb2, p2 * 1.01, 0, #Blue, #Thick ); DrawLine( mb1, m1 + 1, mb2, m2 + 1, MPane, #Blue, #Thick ); for n := pb2 to pb1 do SetPaneBackgroundColor( n, MPane, #RedBkg ); end; end; end; { Divergence between Price and fracMom - bottoms } SetPeakTroughMode( #AsPercent ); pb1 := TroughBar( Bar, #Close, 7 ); pb2 := TroughBar( pb1, #Close, 7 ); p1 := Trough( Bar, #Close, 7 ); p2 := Trough( pb1, #Close, 7 ); SetPeakTroughMode( #AsPoint ); mb1 := TroughBar( Bar, MF, 8 ); mb2 := TroughBar( mb1, MF, 8 ); m1 := Trough( Bar, MF, 8 ); m2 := Trough( mb1, MF, 8 ); if ( Abs( pb1 - mb1 ) < 4 ) and ( Abs( pb2 - mb2 ) < 4 ) then begin if Sign( p1 - p2 ) <> Sign( m1 - m2 ) then begin if pb1 <> lastDrawn then begin lastDrawn := pb1; DrawLine( pb1, p1 * 0.99, pb2, p2 * 0.99, 0, #Red, #Thick ); DrawLine( mb1, m1 - 2, mb2, m2 - 2, MFPane, #Red, #Thick ); for n := pb2 to pb1 do SetPaneBackgroundColor( n, MFPane, #RedBkg ); end; end; end; end;
--Dion Kurczek
Wealth-Lab, Inc.
![]() WEALTH-LAB: TRADE THE PRICE SWINGS
WEALTH-LAB: TRADE THE PRICE SWINGS
The swing trading technique of buying the dips seemed particularly attractive to us for testing the linear regression reversal indicator. As suggested in Barbara Star's article, we used the indicator in both the setup and as a trigger; however, we increased the period of the simple moving average to 21 bars for a more medium-term trend. In addition, instead of requiring that price had to be above or below the average, we imposed the condition that the two-period momentum be greater than a nickel to set up a long entry and less than -0.05 to short.
In Figure 15, notice that we highlighted short and long setups using red and green backgrounds, respectively. When the LR indicator reversed during a setup, we put on a position.
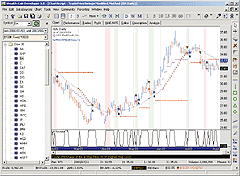
Figure 15: Wealth-Lab, price swings. The red and green backgrounds indicate that the setup condition is active for short and long entries, respectively.
We added an initial 4% protective stop and two trailing stops to
exit with a profit. The stop plotted in magenta activates at 5% profit
and protects against a 40% reversal, whereas the other trailing stop tracks
the moving average once a 10% profit is attained.
A simulation of this trading technique on Boeing (BA) over the period from 01/03/2000 to 08/04/2003 generated $9,762.28 in profits after subtracting $20 round-trip commissions. A $10,000 fixed size was used for all positions.
Though our strategy worked relatively well for Boeing (2.63% annualized gain versus a -4.12% loss for buy and hold), not all other Dow Jones components fared so favorably. Indeed, our Portfolio $imulation of the Dow 30 stocks under the same conditions lost money, giving up nearly $22,500 in commissions alone. This can likely be attributed to many whipsaws during periods in which the trends are not so well defined as the period captured in Figure 15.
The WealthScript code used for the strategy described is presented in
its entirety:
GO BACKvar Bar, p, IndPane, SerMA, SerLinReg, SerLRReversal: integer; var IndicatorValue: float; var LongSetup, ShortSetup: boolean; { -------------------------------- Create Indicators } SerMA := SMASeries( #Close, 21 ); SerLinReg := LinearRegSeries( #Close, 5 ); SerLRReversal := CreateSeries; for Bar := 5 to BarCount - 1 do begin if TurnUp( Bar, SerLinReg ) then IndicatorValue := 1.0; if TurnDown( Bar, SerLinReg ) then IndicatorValue := -1.0; SetSeriesValue( Bar, SerLRReversal, IndicatorValue); end; { -------------------------------- Trading Loop } InstallStopLoss( 4 ); InstallTrailingStop( 5, 40 ); PlotStops; for Bar := 5 to BarCount - 1 do begin ApplyAutoStops( Bar ); if not LastPositionActive then begin { ---------------------------- Initial Set up } if Momentum( Bar, SerMA, 2 ) > 0.05 then begin ShortSetup := false; if TurnDown( Bar, SerLRReversal ) then LongSetup := true; end; if Momentum( Bar, SerMA, 2 ) < -0.05 then begin LongSetup := false; if TurnUp( Bar, SerLRReversal ) then ShortSetup := true; end; { ---------------------------------- Trigger } if LongSetup then begin SetBackgroundColor( Bar, #GreenBkg ); if TurnUp( Bar, SerLRReversal ) then begin BuyAtStop( Bar + 1, PriceLow( Bar ), 'L' ); LongSetup := false; end; end; if ShortSetup then begin SetBackgroundColor( Bar, #RedBkg ); if TurnDown( Bar, SerLRReversal) then begin ShortAtMarket( Bar + 1, 'S' ); ShortSetup := false; end; end; end else { ------------ Moving Avg Trailing Stop } begin p := LastPosition; if PositionOpenMFEPct( p, Bar ) > 10 then if PositionLong( p ) then SellAtTrailingStop( Bar + 1, @SerMA[ Bar ], p, 'TS' ) else CoverAtTrailingStop( Bar + 1, @SerMA[ Bar ], p, 'TS' ); end; end; { -------------------------------- Plot control } EnableTradeNotes( false, true, true ); HideVolume; IndPane := CreatePane( 50, false, false ); PlotSeriesLabel( SerLRReversal, IndPane, #Black, #Thin, 'LR Reversal'); PlotSeriesLabel( SerMA, 0, #Blue, #Dotted, 'SerMA=SMA(#Close,21)' );
-- Robert Sucher
Wealth-Lab, Inc.
www.wealth-lab.com
![]() PROPHET.NET: TRADE THE PRICE SWINGS
PROPHET.NET: TRADE THE PRICE SWINGS
The linear regression reversal indicator (LRR) described by Barbara Star this month is available on the Prophet.Net website to all premium members. No coding is required on the part of the user.
The LRR indicator is available in the advanced studies suite in JavaCharts, found here:
Prophet.Net : Analyze : JavaCharts
https://www.prophet.net/analyze/javacharts.jsp
Click on the Tools menu (which you can also access by right-clicking
anywhere on a chart) and choose "Apply Studies" from the
Studies menu item.
Available from the dropdown menu are two styles of linear regression studies as described by Star:
You can choose any or all of these indicators within the Technical Studies dialog box (Figure 16), and you can set the bar period for either of them; the figure you entered will be shown parenthetically with the indicator itself.
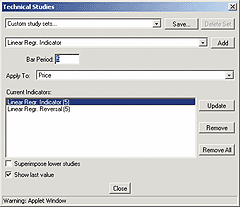
Figure 16: Prophet, technical studies dialog box. Here, you can choose any or all of the available indicators and set the bar period.
This Prophet JavaChart (Figure 17), for example, shows the Lrr shift
on August 11, preceding a healthy upward move by the Qqq for many days
afterward. The Lrr, as a binary indicator, oscillates between +1 (blue
line at the top of the graph) and -1 (blue line on the bottom), with the
changes represented by the vertical blue line.
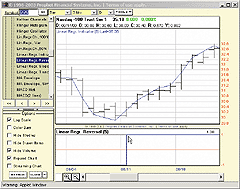
Figure 17: Prophet, the linear regression reversal shift. This chart shows the August 11th linear regression reversal shift, preceding an upward move by the QQQ for days afterward.
The indicator works well with intraday prices too. Figure 18 shows
live hog futures over a couple of days. The LRR reversal early on the Tuesday
morning shown in the chart accurately foresees the movement upward in hogs
over the next several days.
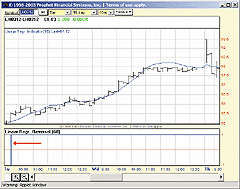
Figure 18: Prophet, reversal indicator. Here, a live hog futures contract is shown with the linear regression reversal indicator (LRR), demonstrating its accurate forecasting ability in the short term.
Premium memberships at Prophet.Net start at $14.95 per month; real-time
market data is available for equities, options, and futures. A seven-day
risk-free trial is available by following this link, which will provide
immediate access to the LRR studies: https://www.prophet.net/tasc
--Prophet.Net
![]() INVESTOR/RT: TRADE THE PRICE SWINGS
INVESTOR/RT: TRADE THE PRICE SWINGS
The buy and sell signals discussed in the swing trading method outlined in this month's article "Trade The Price Swings" can be seen in Figure 19.
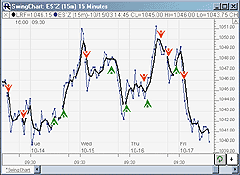
Figure 19: Investor/RT, price swings. This Investor/RT 15-minute connected line (on close) candlestick charts of the e-mini (ES'Z) shows the buy and sell signals of the five-period linear regression-based swing method. The black line represents the endpoints of five-period linear regression lines.
The system calls for a buy signal when price crosses above the five-period linear regression indicator (followed by a close above the previous high), and a sell signal when prices crosses below the five-period linear regression indicator (followed by a close below the previous low). The buy signal and sell signal are coded in Investor/RT using the following syntax:
Buy Signal
LRF.1 > LRF.2 AND LRF.2 <= LRF.3 AND CL > HI.1
Sell Signal
LRF.1 < LRF.2 AND LRF.2 >= LRF.3 AND CL < LO.1
LRF represents the linear regression forecast indicator, using the settings seen in Figure 20.
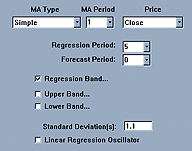
Figure 20: Investor/RT, preferences. Here are the preferences used for the linear regression forecast indicator.
I took these signals and built them into an Investor/RT trading system, adding in the trailing stop, and optimized the system across the following parameters:
Periodicity (from one to 15 minutes, step one minute) Trailing stop (from 0.50 to 4.00 step 0.25) Linear regression period (from three to 12, step 1) MA period (from one to six, step 1)
The moving average period is an optional post-smoothing of the linear regression forecast indicator ("1" giving "no smoothing"). I tested the e-mini contract (day session only) from 9/29/03 to 10/17/03. The combination of parameters that gave the best overall profit (on 63 trades) was an eight-period linear regression with a MA period of 2, a trailing stop of 1.5, and a periodicity of three minutes. The combination that gave the best profit per trade (only three trades however) was a nine-period linear regression with a MA period of 3, a trailing stop of 1.25, and a periodicity of 15-minute.
For more information on this system, including an importable chart definition in Figure 1; details on the swing trading system and optimization of the system; and a more complete list of optimization results, visit the following web page:
https://www.linnsoft.com/charts/swing.htm
--Chad Payne, Linn Software
800-546-6842, info@linnsoft.com
www.linnsoft.com
![]() TECHNIFILTER PLUS: TRADE THE PRICE SWINGS
TECHNIFILTER PLUS: TRADE THE PRICE SWINGS
Here are the formulas discussed in "Trade The Price Swings" by Barbara Star.
The linear regression indicator is a built-in function in Technifilter Plus. To draw a five-period linear regression of the closing price, the formula "CR5" is used.
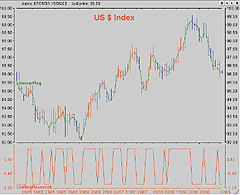
Figure 21: TechniFilter Plus, linear regression reversal indicator. Here is the linear regression line and linear regression reversal indicator plotted with bars colored red when the linear regression reversal indicator is rising and blue when falling.The TechniFilter chart in Figure 21 colors the bars red when the linear regression reversal indicator is rising (+1) and colors them blue when it is falling (-1).
The chart in Figure 22 is based on the swing trading technique mentioned in the article, buying on dips when the price is below the 13-period moving average and the linear regression reversal indicator is rising (+1).
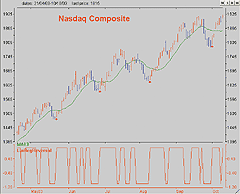
Figure 22: TechniFilter Plus, linear regression reversal indicator. This shows a 13-period simple moving average and the linear regression reversal indicator, with red buy arrows when the price is below the moving average and the linear regression reversal indicator is rising.
The TechniFilter formulas below can be used to add the indicators
to any chart or they can be used in Filter Reports to scan through the
market for signals, or in the Strategy Tester to backtest the signals.
Here are the formulas:
NAME: LinRegLine
FORMULA:
CR5                              {Linear Regression line}
NAME: LinRegReversal
SWITCHES: multiline
FORMULA:
[1]: CR5                         {Linear Regression line}
[2]: IF_Then([1]>[1]Y1,1,-1)     {Trend Reversal Formula}
The following formulas could be used to place buy and sell arrows
on a chart using the swing technique mentioned in Barbara Star's
article:
NAME: LinRegReversalSignalBuy
SWITCHES: multiline
FORMULA:
[1]: CR5                          {Linear Regression}
[2]: IF_Then([1]>[1]Y1,1,-1)      {Trend}
[3]: C-CA13
[4]: IF_THEN(([3]<0 & [2]=1)&TY1<>1,1,-1)U2
NAME: LinRegReversalSignalSell
SWITCHES: multiline
FORMULA:
[1]: CR5                          {Linear Regression}
[2]: IF_Then([1]>[1]Y1,1,-1)      {Trend}
[3]: C-CA13
[4]: IF_THEN(([3]>0 & [2]=-1)&TY1<>1,-1,1)U3
Visit the new home of TechniFilter Plus at https://www.bspark.com.au
to download these formulas and program updates.
--Benzie Pikoos, BrightsparkGO BACK
Tel +61 8 9375-1178, sales@bspark.com.au
www.bspark.com.au
![]() STOCKWIZ: DIVERGENCE BIAS
STOCKWIZ: DIVERGENCE BIAS
Here, the FracMacd and FracMom indicators as described in Giorgos Siligardos' article "Divergence Bias" are given for StockWiz.
#
# The StockWiz formula for plotting the FracMACD indicator as described
# in the TASC December article "Divergence Bias" by Giorgos Siligardos.
#
     (SET STmacd 12)
     (SET LTmacd 26)
     (SET ma_days 7)
     (SET indicator "FracMACD and MACD")
     (ADJUST "ADJUST_FOR_SPLITS_AND_INTERPOLATE")
     (GOTO %SKIP (GSPLIT))
     (ADJUST "RAW_DATA")
     %SKIP: (NA)
     (SET DAYS (GDAYS))
     (SUBSETS 7)
     (SET name (GETSTRING "NAME"))
     (SET ttl name)
     (SAPPEND ttl " [")
     (SAPPEND ttl (CURRENT))
     (SAPPEND ttl "] - ")
     (SET lastCLOSE (LAST (GETVECTOR (CURRENT) "CLOSE")))
     (SAPPEND ttl (DOUBL2STR lastCLOSE "%.03f"))
     (TITLE ttl)
     (SET subttl "Bar Graph with ")
     (SAPPEND subttl (DOUBL2STR ma_days "%.0lf"))
     (SAPPEND subttl " day MA, ")
     (SAPPEND subttl indicator)
     (SUBTITLE subttl)
     (SET OPEN   (GETVECTOR (CURRENT) "OPEN"))
     (SET HIGH   (GETVECTOR (CURRENT) "HIGH"))
     (SET LOW    (GETVECTOR (CURRENT) "LOW"))
     (SET CLOSE  (GETVECTOR (CURRENT) "CLOSE"))
     (SET MA   (MOVAVG  CLOSE ma_days))
     (SET STMA (EMOVAVG CLOSE STmacd))
     (SET LTMA (EMOVAVG CLOSE LTmacd))
     (SET FracMACD (VDIV STMA LTMA))
     (SET MACD (VSUB STMA LTMA))
     (GRAPHSET 1 4 1 0.30 "LHOC")
     (GRAPHSET 2 1 0 0.35 "Line")
     (GRAPHSET 3 1 0 0.35 "Line")
     (LABEL 1 "Price and MA")
     (LABEL 2 "FracMACD")
     (LABEL 3 "MACD")
     (GRAPHADD 1 "GREEN" "THINSOLID" (VLAST LOW DAYS))
     (GRAPHADD 2 "GREEN" "THINSOLID" (VLAST HIGH DAYS))
     (GRAPHADD 3 "GREEN" "THINSOLID" (VLAST OPEN DAYS))
     (GRAPHADD 4 "GREEN" "THINSOLID" (VLAST CLOSE DAYS))
     (GRAPHADD 5 "RED"   "THINSOLID" (VLAST MA DAYS))
     (GRAPHADD 6 "BLUE"  "THINSOLID" (VLAST FracMACD DAYS))
     (GRAPHADD 7 "BLUE"  "THINSOLID" (VLAST MACD DAYS))
     (SHOW)
#
# The StockWiz formula for plotting the FracMOM indicator as described
# in the TASC December article "Divergence Bias" by Giorgos Siligardos.
#
     (SET ma_days 7)
     (SET  mo_days 30)
     %SETUP:
     (SET indicator_name mo_days)
     (SAPPEND indicator_name " day FracMOM amd MOM")
     (ADJUST "ADJUST_FOR_SPLITS_AND_INTERPOLATE")
     (GOTO %SKIP (GSPLIT))
     (ADJUST "RAW_DATA")
     %SKIP: (NA)
     (SET DAYS (GDAYS))
     (SUBSETS 7)
     (SET name (GETSTRING "NAME"))
     (SET ttl name)
     (SAPPEND ttl " [")
     (SAPPEND ttl (CURRENT))
     (SAPPEND ttl "] - ")
     (SET lastCLOSE (LAST (GETVECTOR (CURRENT) "CLOSE")))
     (SAPPEND ttl (DOUBL2STR lastCLOSE "%.03f"))
     (TITLE ttl)
     (SET subttl "Bar Graph with ")
     (SAPPEND subttl ma_days)
     (SAPPEND subttl " day MA, ")
     (SAPPEND subttl indicator_name)
     (SUBTITLE subttl)
     (SET OPEN   (GETVECTOR (CURRENT) "OPEN"))
     (SET HIGH   (GETVECTOR (CURRENT) "HIGH"))
     (SET LOW    (GETVECTOR (CURRENT) "LOW"))
     (SET CLOSE  (GETVECTOR (CURRENT) "CLOSE"))
     (SET xma_days (STR2DOUBL ma_days))
     (SET xmo_days (STR2DOUBL mo_days))
     (SET MA   (EMOVAVG CLOSE xma_days))
     (SET MOM_1 (MOMENTUM CLOSE xmo_days))
     (SET FracMOM (VSDIV MOM_1 100))
     (SET MOM1 (MOMENTUM CLOSE xmo_days))
     (SET MOM2 (VSDIV MOM1 100))
     (SET MOM3 (VSSUB MOM2 1))
     (SET M (VSIZE CLOSE))
     (SET M (SUB M xmo_days))
     (SET Mpast (VGET CLOSE M))
     (SET MOM (VSMUL MOM3 Mpast))
     (GRAPHSET 1 4 1 0.30 "LHOC")
     (GRAPHSET 2 1 0 0.35 "Line")
     (GRAPHSET 3 1 0 0.35 "Line")
     (LABEL 1 "Price and MA")
     (LABEL 2 "FracMOM")
     (LABEL 3 "MOM")
     (GRAPHADD 1 "GREEN" "THINSOLID" (VLAST LOW DAYS))
     (GRAPHADD 2 "GREEN" "THINSOLID" (VLAST HIGH DAYS))
     (GRAPHADD 3 "GREEN" "THINSOLID" (VLAST OPEN DAYS))
     (GRAPHADD 4 "GREEN" "THINSOLID" (VLAST CLOSE DAYS))
     (GRAPHADD 5 "RED"   "THINSOLID" (VLAST MA DAYS))
     (GRAPHADD 6 "BLUE"  "THINSOLID" (VLAST FracMOM DAYS))
     (GRAPHADD 7 "BLUE"  "THINSOLID" (VLAST MOM DAYS))
     (SHOW)
--StockWiz
![]() STOCKWIZ: TRADE THE PRICE SWINGS
STOCKWIZ: TRADE THE PRICE SWINGS
Here is the StockWiz formula for the linear regression reversal indicator discussed in this issue's article "Trade the Price Swings" by Barbara Star.
Sample charts are shown in Figures 23 and 24.
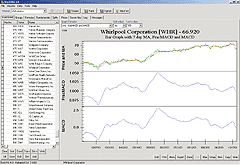
Figure 23: StockWiz, fracMACD. Here's a sample StockWiz chart showing the fracMACD indicator.
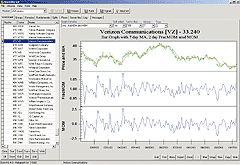
Figure 24: StockWiz, fracMOM. Here's a sample StockWiz chart showing the fracMOM indicator.
# The formula applies a linear regression fit over the last 5 prices for
# every company in the worksheet. It then returns Long {+1}, Short [-1] or
# Neutral <0> signals depending on whether the slope of the linear regression
# is positive, negative or equal to zero respectively. The results are
# displayed in the worksheet where the user can view bar charts with
# simple moving averages, linear regression trend-lines and other indicators
# of the company's price direction.
         (CLEAR)
         (SOURCE "WORKING_GROUP")
         (SET I 0)
         (SET TOTAL (DBSIZE))
         (GRIDFIELD "Name" "STRING" "25")
         (GRIDFIELD "Close" "STRING" "10")
         (GRIDFIELD "LinReg5_LastValue" "STRING" "20")
         (GRIDFIELD "LinReg5_Slope" "STRING" "15")
         (GRIDFIELD "LRreverseSignal" "STRING" "15")
# Get the 5-day range
         (SET LASTDATE  (LASTDATE))
         (SET FIRSTDATE (DATEBSUB LASTDATE 5))
         (GOTO %EXIT (MENU FIRSTDATE LASTDATE))
         (SET STATUS (LOADFIRST))
         (GOTO %ERROR (NE STATUS 0))
%NEXT:   (SET CLOSE (GETVECTOR (CURRENT) "CLOSE"))
         (GOTO %UPDATE (BADDATA CLOSE LASTDATE))
# Create a vector with the last 5 close prices
         (SET VCLOSE (VEC2VEC CLOSE FIRSTDATE LASTDATE))
# Skip over this company if there are less than 5 values in the new vector
         (GOTO %UPDATE (LT (VSIZE VCLOSE) 5))
# Calculate the 5-day linear regression indicator
         (SET LINREG5 (LINREG VCLOSE))
# Calculate the slope of the linear regression indicator
         (SET LR5_SLOPE (SLOPE LINREG5))
# Get the latest value of the LR indicator
         (SET LR (VSIZE LINREG5))
         (SET LR (SUB LR 1))
         (SET LRlast (VGET LINREG5 LR))
# Get the latest Close price
         (SET LASTCLOSE (GETDOUBLE "LastClose"))
# Add the data to the columns in the worksheet
         (GRID (CURRENT) "Close" (DOUBL2STR LASTCLOSE "%.3lf"))
         (GRID (CURRENT) "LinReg5_LastValue" (DOUBL2STR LRlast "%.3lf"))
         (GRID (CURRENT) "LinReg5_Slope" (DOUBL2STR LR5_SLOPE "%.3lf"))
# Issue a signal based on the direction of prices
# as indicated by the slope of the LR indicator
         (GOTO %LONG    (GT LR5_SLOPE 0.0))
         (GOTO %SHORT   (LT LR5_SLOPE 0.0))
         (GOTO %NEUTRAL (EQ LR5_SLOPE 0.0))
%LONG:   (SET SIGNAL "{+1}   LONG")
         (GRID (CURRENT) "Name" (GETSTRING "NAME"))
         (GRID (CURRENT) "LRreverseSignal" SIGNAL)
         (GOTO %UPDATE (TRUE))
%SHORT:  (SET SIGNAL "[-1]   SHORT")
         (GRID (CURRENT) "Name" (GETSTRING "NAME"))
         (GRID (CURRENT) "LRreverseSignal" SIGNAL)
         (GOTO %UPDATE (TRUE))
%NEUTRAL: (SET SIGNAL "< 0 >  NEUTRAL")
         (GRID (CURRENT) "Name" (GETSTRING "NAME"))
         (GRID (CURRENT) "LRreverseSignal" SIGNAL)
         (GOTO %UPDATE (TRUE))
%UPDATE:  (SET I (ADD I 1))
# Exit the formula if the user clicks on the Cancel button
         (GOTO %EXIT (ESCAPE))
# Load the next company in the worksheet
         (SET STATUS (LOADNEXT))
         (GOTO %NEXT (EQ STATUS 0))
         (GOTO %EXIT (TRUE))
%ERROR:  (MESSAGE "An error has occurred - Unable to continue")
%EXIT:   (EXIT 0)
--StockWiz
All rights reserved. © Copyright 2003, Technical Analysis, Inc.
Return to December 2003 Contents