March 2004
TRADERS' TIPS
You can copy these formulas and programs for easy use in your spreadsheet or analysis software. Simply "select" the desired text by highlighting as you would in any word processing program, then use your standard key command for copy or choose "copy" from the browser menu. The copied text can then be "pasted" into any open spreadsheet or other software by selecting an insertion point and executing a paste command. By toggling back and forth between an application window and the open Web page, data can be transferred with ease.
This month's tips include formulas and programs for:
TRADESTATION: Triangular Formations
METASTOCK: Triangular Formations
AMIBROKER: Triangular Formations
eSIGNAL: Triangular Formations
WEALTH-LAB: Triangular Formations
NEUROSHELL TRADER: Triangular Formations
PROPHET.NET: Triangular Formations
TECHNIFILTER PLUS: Triangular Formations
TRADE NAVIGATOR: Volume-Weighted Moving Average (VWMA)
![]() TRADESTATION:
TRIANGULAR FORMATIONS
TRADESTATION:
TRIANGULAR FORMATIONS
Giorgos Siligardos' article in this issue, "Mechanically Recognizing Triangular Formations," describes a method of assessing chart patterns in terms of triangles with falling volume. To accomplish this, a number of factors are calculated and summed to produce the triangle pattern rank (TPR).
The proposed system relies on a zigzag indicator to identify time frames of interest and a retracement factor. Closing prices for the identified time frame are subjected to a direct linear regression analysis and then a secondary linear regression on both negative and positive divergence.
Siligardos proposes factors for assessing the results of these regression
analyses. Further, there is a crossover test and declining volume test.
Once all these factors are calculated, then summed, a high TPR (12 is the
maximum possible value) indicates a potentially profitable trading opportunity.
The following strategy allows you to make the calculations and test the
ideas.
Strategy: MechTriangleBreakOut
inputs:
 RetraceAmt( 1 ),
 LookBackPeriod( 150 ),
 LossPercent( 3 ),
  TrailPercent( 15 ),
 TPRGoal( 11 ),
 HighLen( 6 ),
 LowLen( 6 ),
 TradeWindow( 10 ) ;
variables:
 PointA( 0 ),
 PointB( 0 ),
  SwingDateB( 0 ),
 SwingTimeB( 0 ),
 SwingPriceB( 0 ),
 SwingDateA( 0 ),
 SwingTimeA( 0 ),
 SwingPriceA( 0 ),
  BarsBackA( 0 ),
 BarsBackB( 0 ),
  oLRSlope( 0 ),
 oLRAngle( 0 ),
 oLRIntercept( 0 ),
 oLRValue( 0 ),
 Counter( 0 ),
 RegLinePrice( 0 ),
 TempUpPrice( 0 ),
 TempDownPrice( 0 ),
 UpFlag( false ),
 DownFlag( false ),
 UpCounter( 0 ),
 DownCounter( 0 ),
 Retracement( 0 ),
 VolumeSlope( 0 ),
 CrossCounter( 0 ),
 TPR( 0 ),
 BuyStop( 0 ),
 SellShortStop( 0 ),
 TradeCondition( false ),
 TradeCount( 0 ) ;
arrays:
 TempUp[1000]( 0 ),
 TempDown[1000]( 0 ) ;
{Find the zigzags and bars back to them}
Value1 = ZigZag2( Close, 1, RetraceAmt, red, 1, true,
 SwingDateB, SwingtimeB, SwingPriceB,
 SwingDateA, SwingTimeA, SwingPriceA ) ;
if SwingDateB <> 0 and SwingDateA <> 0 then
 begin
 BarsBackA = 0 ;
 BarsBackB = 0 ;
 for Value1 = 1 to LookBackPeriod
  begin
  if SwingDateB = Date[Value1]
   and SwingTimeB = Time[value1]
  then
   BarsBackB = Value1 ;
  if SwingDateA = Date[Value1]
   and SwingTimeA = Time[Value1]
  then
   BarsBackA = Value1 ;
  if BarsBackA > 0 and BarsBackB > 0 then
   Value1 = 10000000 ;
  end ;
 end ;
 { Linear Reg slope and intercept from close[0]
 to most recent zigzag turn }
 Value1 = LinearReg( Close, BarsBackB+1, 0,
  oLRSlope, oLRAngle, oLRIntercept, oLRValue ) ;
 { Calculate TempUp and TempDown }
 UpCounter = 0 ;
 UpFlag = true ;
 DownCounter = 0 ;
 DownFlag = true ;
 CrossCounter = 0 ;
 for Value1 = 1 to BarsBackB
  begin
  Counter = BarsBackB - ( Value1 - 1 ) ;
  RegLinePrice = Counter*oLRSlope + oLRIntercept ;
  if Close[Counter] > RegLinePrice  then
   begin
   if UpFlag then
    Upflag = false ;
   if DownFlag then
    DownCounter = DownCounter + 1 ;
   TempUp[Counter] =
    Close[Counter] - RegLinePrice ;
   if DownFlag = false then
    TempDown[Counter] =
     TempDown[ Counter + 1 ] ;
   end
  else
   begin
   if DownFlag then
    DownFlag = False ;
   if UpFlag then
    UpCounter = UpCounter + 1 ;
   TempDown[Counter] =
    Close[Counter] - RegLinePrice ;
   TempUp[Counter] = TempUp[ Counter + 1 ] ;
   end ;
  if ( Close[ Counter + 1 ] > RegLinePrice
   and Close[Counter] < RegLinePrice )
   or ( Close[ Counter + 1 ] < RegLinePrice
   and Close[Counter] > RegLinePrice )
  then
   CrossCounter = CrossCounter + 1 ;
 Value3 = LinRegArray( TempUp,
  BarsBackB - UpCounter + 1, 0, oLRSlope,
  oLRAngle, oLRIntercept, Value5 ) ;
 Value4 = LinRegArray( TempDown,
  BarsBackB - DownCounter + 1, 0, oLRSlope,
  oLRAngle, oLRIntercept, Value5 ) ;
 { Calculate the retracement value }
 Retracement = AbsValue( SwingPriceB - Close)
  / AbsValue( SwingPriceA - SwingPriceB ) * 100 ;
 { Calculate volume slope }
 VolumeSlope = LinearRegSlope( Volume, BarsBackB ) ;
 TPR = 1 ;
 { Time factor }
 if BarsBackB >= 15 and BarsBackB < 30 then
  TPR = 2 ;
 if BarsBackB >= 30 and BarsBackB <= 55 then
  TPR = 1 ;
 { R-squared factor }
 Value7 = StdError( Close, BarsBackB ) ;
 if Value7 < .2 then
  TPR = TPR + 2
 else if Value7 >= .2 and Value7 < .5 then
  TPR = TPR + 1 ;
 { Retracement value }
 if Retracement < 20 then
  TPR = TPR + 4
 else if Retracement >= 20 and Retracement < 38 then
  TPR = TPR + 3 ;
 { Volume slope value }
 if VolumeSlope < 0 then
  TPR = TPR + 4 ;
 Print( Date, " " , Time, " ", TPR ) ;
 end ;
if MarketPosition <> 0 then
 TradeCondition = false ;
if TPR = TPRGoal then
 begin
 TradeCondition = true ;
 TradeCount = 0 ;
 BuyStop = Highest( High, HighLen ) ;
 SellShortStop = Lowest( Low, LowLen ) ;
 end ;
if TradeCondition and TradeCount < TradeWindow then
 begin
 Buy next bar at BuyStop stop ;
 SellShort next bar at SellShortStop stop ;
 end ;
SetStopShare ;
SetStopLoss( LossPercent/100 * Close ) ;
SetDollarTrailing( TrailPercent/100 * Close ) ;
An Eld file including the above EasyLanguage strategy and required
function ZigZag2 will be available for download from the EasyLanguage Exchange
on www.tradestationworld.com. Look for the file "MechTriangle.eld."
In addition, you might find the built-in indicators Pennant BrkOut, Pennant
BrkOut Up, and Pennant BrkOut Dn of interest. Like Siligardos' proposals,
they use linear regression to identify a specific chart pattern in a mechanical
fashion.
A sample chart is in Figure 1.
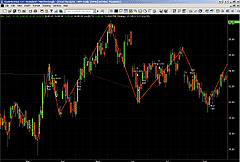
FIGURE 1: TRADESTATION, TRIANGULAR FORMATION. This sample TradeStation chart shows the triangle pattern rank (TPR) indicator.
--Mark Mills and Eric Tangen
MarkM@TSSec at www.TradeStationWorld.com
EasyLanguage Questions Forum
TradeStation Securities, Inc.
A subsidiary of TradeStation Group, Inc.
![]() METASTOCK:
TRIANGULAR FORMATIONS
METASTOCK:
TRIANGULAR FORMATIONS
Editor's note: Code for MetaStock appeared in Giorgos Siligardos' article on page 36 of this issue.
METASTOCK CODE FOR TPR EXPLORATIONS
----------------------------------------------------------
Use the code below as a filter to identify TFs that last up to 60 trading
days and produce retracements of no more than 50%. In column A, write exactly
the same code, but in the last line substitute "TPR>0" with
"TPR." You may also name column A as "TPR."
The code works with daily charts and requires the zz(20%) to have produced
at least four swings in chart history to function properly.
----------------------------------------------------------
{Main}
zz:=Zig(C,20,%);
x:=Min(BarsSince(zz>Ref(zz,-1) AND Ref(zz,-1)<Ref(zz,-2)),BarsSince(zz<Ref(zz,-1) AND Ref(zz,-1)>Ref(zz,-2)));
I:=LastValue(x)+1;
xM:=LastValue(I/2);
A:=LastValue( LinRegSlope(C ,I ) );
{regression line}
reg:= A*x+LastValue(LinearReg(C,I))-A*(I-1);
{Up And Down Indicators}
day1:=LastValue(ValueWhen(1,x=0,DayOfMonth()));
Month1:=LastValue(ValueWhen(1,x=0,Month()));
year1:=LastValue(ValueWhen(1,x=0,Year()));
OK:=BarsSince(day1=DayOfMonth() AND month1=Month() AND year1=Year())>=0;
down:=If(OK=False,0,If(Min(C-reg,0)=0,PREV,Min(C-reg,0)));
up:=If(OK=False,0,If(Max(C-reg,0)=0,PREV,Max(C-reg,0)));
{Slope of up and down indicators}
Id:=LastValue(Cum(Alert(OK AND C<reg,I)));
Iu:=LastValue(Cum(Alert(OK AND C>reg,I)));
downSlope:=Sum( (x-xM)*(down- LastValue(Sum(down,Id)/Id)) ,Id)/Sum( (x-xM)*(x-xM),Id);
upSlope:=Sum( (x-xM)*(up- LastValue(Sum(up,Iu)/Iu)) ,Iu)/Sum( (x-xM)*(x-xM),Iu);
{Short Term Swings}
SS:=Sum(If(Cross(Mov(C,5,S),reg),1,0)+If(Cross(reg,Mov(C,5,S)),1,0),I-1);
{Max Retracement}
retr:=Max(Abs(C-HHV(C,I+1)),Abs(C-LLV(C,I+1)))
/Abs(ValueWhen(2,x=0,C)-ValueWhen(1,x=0,C))*100;
{Volume slope}
VolSlope:=Sum( (x-xM)*(V- LastValue(Sum(V,I)/I)) ,I)/Sum( (x-xM)*(x-xM),I);
{TPR Formula }
TPR:=
If(I>=10 AND I<=60 AND downSlope>0 AND upSlope<0 AND
retr<50 AND
SS>=3,
{Time}
If(I>=15 AND I<30,2,0) +
If(I>=30 AND I<=55,1,0) +
{r^2}
If(RSquared(C,I)<0.2,2,0) +
If(RSquared(C,I)>=0.2 AND RSquared(C,I)<0.5,1,0) +
{Max retracement}
If(retr<20,4,0) +
If(retr>=20 AND retr<38,3,0) +
{Volume}
If(VolSlope<0,4,0)+1,0);
TPR>0
![]() AMIBROKER:
TRIANGULAR FORMATIONS
AMIBROKER:
TRIANGULAR FORMATIONS
In "Mechanically Recognizing Triangular Formations," Giorgos Siligardos presents a way to detect triangular price patterns programmatically.
Calculations presented in the article can be easily reproduced using AmiBroker Formula Language. Listing 1 shows ready-to-use exploration code that should be applied in the Automatic Analysis window (Figure 2). The user may adjust the zigzag percent threshold value at the top of the formula to detect smaller or bigger formations. The code is also available for download from AmiBroker's website.

FIGURE 2: AMIBROKER, TRIANGLE FORMATIONS IDENTIFIED. Shown here is AmiBroker's automatic analysis window with exploration results. The list shows stocks for which a triangular formation has been identified. Out of the database of 8,000+ stocks, 76 stocks were detected with the proper pattern. Exploration took only 50 seconds to complete.
LISTING 1
// Triangular Formation Exploration
// Use in Automatic Analysis -> Explore
//
// you can modify PercentThreshold below
PercentThreshold = 20;
///
function RSquared( array, periods )
{
   return Correlation( Cum(1), array, periods ) ^ 2;
}
// 20% zig-zag
zz = Zig(C, PercentThreshold );
x = Min( BarsSince( zz > Ref(zz,-1) AND Ref( zz, -1 ) < Ref( zz, -2 ) ),
         BarsSince( zz < Ref(zz,-1) AND Ref( zz, -1 ) > Ref( zz, -2 ) ) );
I = LastValue( x )+1;
xM = LastValue( I / 2 );
A = LastValue( LinRegSlope( C ,I ) );
// Regression line
reg = A*x + LastValue( LinearReg( C, I ) ) - A*(I-1);
// Up AND Down Indicators
day1    = LastValue( ValueWhen( x == 0, Day() ) );
Month1   = LastValue( ValueWhen( x == 0, Month() ) );
year1  = LastValue( ValueWhen( x == 0, Year() ) );
OK = BarsSince( day1 == Day() AND month1 == Month() AND year1 == Year() ) >= 0;
downm = Min( C-reg, 0 );
down = IIf( NOT OK, 0, ValueWhen( downm != 0, downm ) );
upm = Max( C-reg, 0 );
up = IIf( NOT OK, 0, ValueWhen( upm !=0, upm ) );
// Slope of up AND down indicators
Id = LastValue( Cum( Hold( OK AND C<reg, I ) ) );
Iu = LastValue( Cum( Hold( OK AND C>reg, I ) ) );
downSlope = Sum( ( x - xM ) *
( down - LastValue( Sum( down, Id )/ Id ) ) ,Id) /
            Sum( ( x - xM ) * ( x - xM ), Id );
upSlope = Sum( ( x - xM ) * ( up - LastValue( Sum( up, Iu )/Iu ) ), Iu ) /
          Sum(( x- xM )^2, Iu );
// Short Term Swings
SS = Sum( Cross( MA( C, 5 ), reg) + Cross( reg, MA( C, 5 ) ), I - 1);
// Max Retracement
retr = Max( abs( C-HHV(C,I+1)), abs(C-LLV(C,I+1)) ) /
       abs( ValueWhen( x==0, C, 2 )- ValueWhen( x==0, C, 1 ) ) *100;
// Volume slope
VolSlope =Sum( ( x - xM )*( V - LastValue( Sum( V, I )/I ) ), I )/
Sum( ( x - xM )^2, I);
//TPR Formula
TPR = IIf( I >= 10 AND I <= 60 AND downSlope > 0 AND upSlope < 0 AND retr < 50 AND SS >= 3,
// Time
IIf(I >= 15 AND I < 30, 2, 0 ) +
IIf(I >= 30 AND I <= 55, 1, 0 ) +
//r^2
IIf( RSquared( C, I) < 0.2, 2, 0) +
IIf( RSquared( C, I) >= 0.2 AND RSquared(C,I) < 0.5, 1, 0 ) +
//Max retracement
IIf( retr < 20, 4, 0 ) +
IIf( retr >= 20 AND retr < 38, 3, 0 ) +
//Volume
IIf( VolSlope < 0, 4, 0 ) + 1,
/*otherwise*/ 0);
Filter = TPR > 0;
AddColumn( TPR, "TPR" );
--Tomasz Janeczko, AmiBroker.com
www.amibroker.com
![]() eSIGNAL:
TRIANGULAR FORMATIONS
eSIGNAL:
TRIANGULAR FORMATIONS
The following eSignal Formula Script (EFS) study is based on Giorgos Siligardos' article, "Mechanically Recognizing Triangular Formations."
Here are the eSignal formulas for "Mechanically Recognizing Triangular
Formations" by Giorgos Siligardos in this issue.
/*****************************************************************
Provided By : eSignal. (c) Copyright 2004
Study:        Triangular Pattern Rank
Version:      1.0
Formula Parameters:                 Default:
    * Swing: # of Bars              1
        This is the minimum number of bars required to define a
        swing point.  This number is for both sides of the swing
        point (i.e. 5 bars on the left and right of the swing bar).
    * Swing: Wave Type              % Change in Price
        (% Retracement, % Change in Price)
    * Swing: Wave Percentage        20
        The number 3 represents 3.0%.  The number 0.03
        represents 0.0003%.
    * Swing High Price Source       Close
    * Swing Low Price Source        Close
    * Line Thickness                2
    * Confirmed Swing Line Color    Blue
    * Developing Swing Line Color   Yellow
*****************************************************************/
function preMain() {
    setPriceStudy(true);
    setStudyTitle("Triangular Pattern Rank ");
    setShowCursorLabel(false);
    setShowTitleParameters(false);
    setDefaultBarFgColor(Color.cyan);
    //setComputeOnClose();

    var fp1 = new FunctionParameter("nNum", FunctionParameter.NUMBER);
    fp1.setName("Swing: # of Bars");
    fp1.setLowerLimit(1);
    fp1.setDefault(1);

    var fp2a = new FunctionParameter("sWaveType", FunctionParameter.STRING);
    fp2a.setName("Swing: Wave Type");
    fp2a.addOption("% Retracement");
    fp2a.addOption("% Change in Price");
    fp2a.setDefault("% Change in Price");

    var fp2 = new FunctionParameter("nRet", FunctionParameter.NUMBER);
    fp2.setName("Swing: Wave Percentage");
    fp2.setLowerLimit(0);
    fp2.setDefault(20);
    var fp3 = new FunctionParameter("sHighSource", FunctionParameter.STRING);
    fp3.setName("Swing High Price Source");
    fp3.addOption("Open");
    fp3.addOption("High");
    fp3.addOption("Low");
    fp3.addOption("Close");
    fp3.setDefault("Close");
    var fp4 = new FunctionParameter("sLowSource", FunctionParameter.STRING);
    fp4.setName("Swing Low Price Source");
    fp4.addOption("High");
    fp4.addOption("Low");
    fp4.addOption("Close");
    fp4.setDefault("Close");
    var fp5 = new FunctionParameter("nThickness", FunctionParameter.NUMBER);
    fp5.setName("Line Thickness");
    fp5.setLowerLimit(1);
    fp5.setDefault(2);
    var fp6 = new FunctionParameter("cColor1", FunctionParameter.COLOR);
    fp6.setName("Confirmed Swing Line Color");
    fp6.setDefault(Color.blue);
    var fp7 = new FunctionParameter("cColor2", FunctionParameter.COLOR);
    fp7.setName("Developing Swing Line Color");
    fp7.setDefault(Color.yellow);
}
var cntr = 0;           // image counter for swing lines
var bInit = false;      // initialization routine completion
var nNumBars = null;    // number of bars for defining swings
var sWaveTypeG = null;  // wave type for confirming swings
var nRetpcnt = null;    // percent retracement for defining swings
var nThicknessG = null; // line thickness
var cColorCon = null;   // confirmed swing color
var cColorDev = null;   // developing swing color
var sHSource = null;    // price source for high swings
var sLSource = null;    // price source for low swings
var x1a = null;         // x-coordinate for point a of developing line 1
var x1b = null;         // x-coordinate for point b of developing line 1
var x2a = null;         // x-coordinate for point a of developing line 2
var x2b = null;         // x-coordinate for point b of developing line 2
var y1a = null;         // y-coordinate for point a of developing line 1
var y1b = null;         // y-coordinate for point b of developing line 1
var y2a = null;         // y-coordinate for point a of developing line 2
var y2b = null;         // y-coordinate for point b of developing line 2
var vLastSwing = null;  // tracking swing type of last confirmed swing
var nScntr = 0;         // bar counter for swing confirmation
var nSpace = null;      // space between labels and bars
var A = null;           // Linear Regression y = Ax + B
var B = null;           // Linear Regression y = Ax + B
var r2 = 0;             // Linear Regression r-squared
var MA5 = null;         // 5 period MA Study
var SS = 0;             // Small Swings counter
var nTPR = 0;           // Triangular Pattern Rank
function main(nNum, sWaveType, nRet, sHighSource, sLowSource, nThickness, cColor1, cColor2) {
    var nState = getBarState();
    var nIndex = getCurrentBarIndex();
    var h = getValue(sHighSource);
    var l = getValue(sLowSource);
    var c = close();
    // record keeping
    if (nState == BARSTATE_NEWBAR) {
        if (cntr > 100) cntr = 0;
        if (x1a != null) x1a -= 1;
        if (x1b != null) x1b -= 1;
        if (x2a != null) x2a -= 1;
        if (x2b != null) x2b -= 1;
    }
    //Initialization
    if (nNumBars == null) nNumBars = nNum;
    if (sWaveTypeG == null) sWaveTypeG = sWaveType;
    if (nRetpcnt == null) nRetpcnt = nRet/100;
    if (nThicknessG == null) nThicknessG = nThickness;
    if (cColorCon == null) cColorCon = cColor1;
    if (cColorDev == null) cColorDev = cColor2;
    if (sHSource == null) sHSource = sHighSource;
    if (sLSource == null) sLSource = sLowSource;
    if (x1a == null) x1a = 0;
    if (y1a == null) y1a = c;
    if (nSpace == null) {
        nSpace = ((high() - low())*.2);
        TFlabels(false, "NA");
    }
    if (MA5 == null) MA5 = new MAStudy(5, 0, "Close", MAStudy.SIMPLE);
    if (bInit == false) {
        bInit = Init(h,l,c);
    }
    // Swings
    if (nState == BARSTATE_NEWBAR) {
        nScntr += 1;
        // confirm Swings
        if (nScntr > nNumBars) {
            confirmSwings();
            if (bInit == true) {
                doLine("dev1");
                doLine("dev2");
            }
        }
    }
    checkSwings(h, l);
    if (bInit == true) doLine("dev2");

    //Linear Regression
    RegTriangle();
    return MA5.getValue(MAStudy.MA);
}
/***********************/
/****** Functions *****/
function Init(h,l,c) {
    if (close(-(nNumBars*2)) == null) {
        return false;
    } else {
        // Find initial line.
        // The initial line will be the first high or low swing,
        // which has the greater difference of the swing point to
        // the close of the first bar.
        var Index = getCurrentBarIndex()
        var hIndex = Index;
        var lIndex = Index;
        var j = nNumBars*2;
        var aHigh = getValue(sHSource, 0, -j);
        var aLow = getValue(sLSource, 0, -j);
        var vHH = aHigh[0];
        var vLL = aLow[0];
        var tempIndex = Index;
        var i = 0;
        for (i = 0; i < j; ++i) {
            if (aHigh[i] > vHH) {
                vHH = aHigh[i];
                hIndex = tempIndex;
            }
            if (aLow[i] < vLL) {
                vLL = aLow[i];
                lIndex = tempIndex;
            }
            tempIndex -= 1;
        }
        if (vHH - y1a > y1a - vLL) {
            vLastSwing = "L";
            x1b = hIndex - Index;
            y1b = vHH;
            doLine("dev1");
            x2a = x1b;
            y2a = vHH;
            x2b = 0;
            y2b = c;
            doLine("dev2");
        } else {
            vLastSwing = "H";
            x1b = lIndex - Index;
            y1b = vLL;
            doLine("dev1");
            x2a = x1b;
            y2a = vLL;
            x2b = 0;
            y2b = c;
            doLine("dev2");
        }
    }

    if (vLastSwing != null) {
        return true;
    } else {
        return false;
    }
}
function doLine(sType) {
    //confirmed
    if (sType == "con") {
        cntr += 1;
        drawLineRelative(x1a, y1a, x1b, y1b, PS_SOLID,
            nThicknessG, cColorCon, sType+cntr);
        x1a = x2a;
        y1a = y2a;
        x1b = x2b;
        y1b = y2b;
        x2a = x1b;
        y2a = y1b;
        if (vLastSwing == "H") y2b = getValue(sHSource);
        if (vLastSwing == "L") y2b = getValue(sLSource);
    }
    // dev1
    if (sType == "dev1") {
        drawLineRelative(x1a, y1a, x1b, y1b, PS_SOLID,
            nThicknessG, cColorDev, sType);
    }

    // dev2
    if (sType == "dev2") {
        if (x2a != 0 && x2a != x2b) {
            drawLineRelative(x2a, y2a, x2b, y2b, PS_SOLID,
                nThicknessG, cColorDev, sType);
        } else {
            removeLine(sType);
        }
    }

    return;
}
function TFlabels(bTF, nSS) {
    drawTextAbsolute(2, 100, "TF = "+bTF, Color.maroon, null,
        Text.BOLD|Text.ONTOP|Text.LEFT|Text.BOTTOM|Text.RELATIVETOBOTTOM,
        null, 14, "TF");
    var nR = (Math.abs(y2a-y2b) / Math.abs(y1b-y1a));
    if (nR > 0) {
        nR = (100*nR).toFixed(2) + "%";
    } else {
        nR = "NA";
    }
    drawTextAbsolute(2, 80, "TPR = "+nTPR, Color.maroon, null,
        Text.BOLD|Text.ONTOP|Text.LEFT|Text.BOTTOM|Text.RELATIVETOBOTTOM,
        null, 14, "TPR");
    drawTextAbsolute(2, 40, "%Ret = "+nR, Color.maroon, null,
        Text.BOLD|Text.ONTOP|Text.LEFT|Text.BOTTOM|Text.RELATIVETOBOTTOM,
        null, 14, "Ret");
    drawTextAbsolute(2, 20, "SS = "+nSS, Color.maroon, null,
        Text.BOLD|Text.ONTOP|Text.LEFT|Text.BOTTOM|Text.RELATIVETOBOTTOM,
        null, 14, "SS");
    return;
}
function confirmSwings() {
    if (x1b != x2b) {   // underdeveloped dev1 line
        if (sWaveTypeG == "% Retracement") {
            var nWave = (Math.abs(y2a-y2b) / Math.abs(y1b-y1a));
        } else {
            var nWave = (Math.abs(y2a-y2b) / y1b);
        }
        if (vLastSwing == "L" && nWave >= nRetpcnt ) {
            // Swing High
            nScntr = 0;
            vLastSwing = "H";
            doLine("con");
        } else if (vLastSwing == "H" && nWave >= nRetpcnt ) {
            // Swing Low
            nScntr = 0;
            vLastSwing = "L";
            doLine("con");
        }
    }

    return;
}
function checkSwings(h, l) {
    // dev1
    if (vLastSwing == "L") {         // find Swing High
        if (h >= y1b) {  // higher high, no swing
            nScntr = 0;
            x1b = 0;
            y1b = h;
            doLine("dev1");
            x2a = 0;
            y2a = h;
        }
    } else if (vLastSwing == "H") {  // find Swing Low
        if (l <= y1b) {  // Lower low, no swing
            nScntr = 0;
            x1b = 0;
            y1b = l;
            doLine("dev1");
            x2a = 0;
            y2a = l;
        }
    }
    // dev2
    if (nScntr == 0) {
        x2b = 0;
        if (vLastSwing == "H") y2b = h;
        if (vLastSwing == "L") y2b = l;
    } else {
        if (vLastSwing == "H" && h >= y2b) {
            y2b = h; x2b = 0;
        } else if (vLastSwing == "L" && l <= y2b) {
            y2b = l; x2b = 0;
        }
    }
    return;
}
function RegTriangle() {
    var nState = getBarState();
    var nIndex = getCurrentBarIndex();
    var i = 0;

    // y = Ax + B;
    // A = SUM( (x-xAVG)*(y-yAVG) ) / SUM( (x-xAVG)^2 )
    // B = yAVG - (A*xAVG)
    // Slope = -1 * A

    if (nScntr < 10 || nScntr > 60) {
        //removeLine("reg");
        removeLine("Up");
        removeLine("Dn");
        nTPR = 0;
        TFlabels(false, 0);
    } else {
        var aReg = close(0, -nScntr);
        var vClose = aReg[0];
        if (aReg[nScntr-1] != null) {
            LinReg(aReg, aReg.length, true);
            // Reg
            //drawLineRelative(0, B, -(nScntr-1), (A*(nScntr-1)) + B, PS_SOLID, 1, Color.blue, "reg");
            //Up and Down indicators
            var aUp = new Array(nScntr);
            var aDn = new Array(nScntr);
            var RegValue = B;   // Reg indicator values
            SS = 0; // Small Swings
            i = 0;
            for (i = 0; i < nScntr; ++i) {
                if (aReg[i] > RegValue) {
                    aUp[i] = aReg[i];
                }
                if (aReg[i] < RegValue) {
                    aDn[i] = aReg[i];
                }
                if (i < nScntr-1) {
                    var vMA0 = MA5.getValue(MAStudy.MA, -i);
                    var vMA1 = MA5.getValue(MAStudy.MA, (-i-1));
                    if (vMA0 > RegValue && vMA1 <= RegValue + A) SS += 1;
                    if (vMA0 < RegValue && vMA1 >= RegValue + A) SS += 1;
                }
                RegValue += A;
            }
            i = 0;
            var j = 0;
            for (i = 0; i < nScntr; ++i) {
                if (aUp[i] == null) {
                    j = 0;
                    for (j = i+1; j < nScntr; ++j) {
                        if (aUp[j] != null) {
                            aUp[i] = aUp[j];
                            j = nScntr;
                        }
                    }
                }
                if (aDn[i] == null) {
                    j = 0;
                    for (j = i+1; j < nScntr; ++j) {
                        if (aDn[j] != null) {
                            aDn[i] = aDn[j];
                            j = nScntr;
                        }
                    }
                }
            }
            LinReg(aUp, aUp.length, false);
            var UpSlope = -A;
            drawLineRelative(0, B, -(nScntr-1), (A*(nScntr-1)) + B, PS_SOLID, 2, Color.red, "Up");
            LinReg(aDn, aDn.length, false);
            var DnSlope = -A;
            drawLineRelative(0, B, -(nScntr-1), (A*(nScntr-1)) + B, PS_SOLID, 2, Color.red, "Dn");
        }
        /*** Triangular Formation (TF) ***/
        var bTF = true;
        var pcntRetracement = (Math.abs(y2a-y2b) / Math.abs(y1b-y1a));
        if (SS < 3) bTF = false;
        if (UpSlope >= 0 || DnSlope <= 0) bTF = false;
        if (pcntRetracement > 0.50) bTF = false;
        if (bTF == false) nTPR = 0;

        /*** Triangular Pattern Rank (TPR) ***/
        if (bTF == true) {
            nTPR = 1;
            //rule 1
            if (nScntr >= 15 && nScntr <= 30) nTPR += 2;
            if (nScntr > 30 && nScntr <= 55) nTPR += 1;
            //rule 2
            if (r2 <= 0.2) nTPR += 2;
            if (r2 > 0.2 && r2 <= 0.5) nTPR += 1;
            //rule 3
            if (pcntRetracement <= 0.20) nTPR += 4;
            if (pcntRetracement > 0.20 && pcntRetracement <= 0.38) nTPR += 3;
            //rule 4
            var aVol = volume(0, -nScntr);
            LinReg(aVol, aVol.length, false);
            if (-A < 0) nTPR += 4;
        }
        TFlabels(bTF, SS);
    }

    return;
}
function LinReg(vArray, nLength, bR2) {
    var Len = nLength;
    var xSum = 0;
    var ySum = 0;
    var i = 0;
    for (i = 0; i < nLength; ++i) {
        if (vArray[i] == null) Len -= 1;
    }
    for (i = 0; i < Len; ++i) {
        xSum += i;
        ySum += vArray[i];
    }
    var xAvg = xSum/Len;
    var yAvg = ySum/Len;
    var aSum1 = 0;
    var aSum2 = 0;
    var aSum3 = 0;
    i = 0;
    for (i = 0; i < Len; ++i) {
        aSum1 += (i-xAvg) * (vArray[i]-yAvg);
        aSum2 += (i-xAvg)*(i-xAvg);
        aSum3 += (vArray[i]-yAvg)*(vArray[i]-yAvg);
    }

    A = (aSum1 / aSum2);
    B = yAvg - (A*xAvg);

    // r-squared
    if (bR2 == true) r2 = (aSum1*aSum1) / (aSum2*aSum3);

    return;
}
In Figure 3, the yellow lines are the last two developing legs of
the zigzag indicator. As swing points are confirmed, the confirmed portion
of the zigzag's historical lines become blue. The cyan line is the
five-period simple moving average. The red lines are the regression lines
based on the TempUp and TempDown indicators, which are the basis for the
triangular formations. To the right of the price bars, you will see some
information displayed that determines when a triangular formation (TF)
has been found. If a TF has been found (that is, TF = true), then you will
see a rank for the current triangular pattern rank (TPR). The current percent
retracement (%Ret) and small swings count (SS) are also displayed for quick
reference.

FIGURE 3: eSIGNAL, TRIANGLE FORMATIONS. If a triangular formation has been found (that is, TF = true), then you will see a rank for the current triangular pattern rank (TPR). The current percent retracement (%Ret) and small swings count (SS) are also displayed for quick reference.
Note that these zigzag lines are a bit different from some of the
examples used in Giorgos Siligardos' article in this issue, "Mechanically
Recognizing Triangular Formations." This is simply due to a difference
in the code logic used for this EFS study. Siligardos' B-r line
would be displayed on our chart from point B to the current bar's
close. Even though our last developing line is not displayed in that fashion,
the rest of the logic for determining TF and TPR follow Siligardos'
constructs. This difference exists because this indicator is also designed
to be used in real time. If you apply it to an intraday interval, you will
see the developing lines updated accordingly as new data streams to the
chart.
Improving computation speed
Please be aware that when using this formula in real time, you may experience above-average CPU usage, depending on your symbol, interval, time template, and hardware configuration. To improve real-time efficiency, open the formula in eSignal's Formula Editor (Tools-->EFS-->Editor) and remove the two forward slashes ("//") on line 30 in front of the "setComputeOnClose()" function. This will force the formula to only execute on the close of each bar.
Adjusting parameters
The formula has several parameters that can be changed from the "Edit Studies" option in the advanced chart. After applying the formula, right-click on the chart and select "Edit Studies." Then select the formula, "Triangular Pattern Rank, >"from the drop-down box at the top of the Study Properties window that appears. The parameter defaults are set to be used according to Siligardos' settings and for a daily chart interval. If you use the formula on intraday intervals, you may need to adjust the parameters that define the swings, or zigzags. The "Swing: # of Bars" can be used to force a swing point to have at least x number of bars before and after that are all below the swing high, for example. The "Swing: Wave Type" can be set to use % change in price or % retracement from the previous swing point to define the new swing points. The rest should be self-explanatory.
If readers have any questions or ideas, feel free to visit our forums at the links provided and join our online discussion regarding this study.
--Jason Keck
eSignal, a division of Interactive Data Corp.
800 815-8256, www.esignal.com
![]() WEALTH-LAB:
TRIANGULAR FORMATIONS
WEALTH-LAB:
TRIANGULAR FORMATIONS
Detecting chart pattern formations can be easy for the human eye but difficult for a mechanical system such as a computer. One very effective method of detecting chart formations is to examine the most recent peak and trough levels in the chart and determine whether the relationship between them is consistent with the pattern in question.
Here, we present an example of this technique that is remarkably effective at detecting symmetrical triangles in advancing markets (the script could be easily modified to detect other types of triangular patterns). In addition to signaling when a triangle is currently being formed, the script also identifies all historical instances of the triangle formation in the chart. The script even draws the triangle formation lines for us automatically, as well as the dotted convergence lines. The triangle patterns can be easily spotted when looking through your charts.
We start by applying a zigzag indicator to the highs and lows, using
a specified price reversal amount. We then make note of the three most
recent troughs in the chart (T1, T2, and T3) and the two most recent peaks
(P1 and P2) (Figure 4). We ensure that the peaks and troughs occur in the
correct chronological order, and that the peaks are declining while the
troughs are advancing. Because chart patterns can evolve over a variety
of time frames, we created a separate function to detect the pattern based
on a specified reversal percentage. At the end of our script, we call the
function with four different reversal percentages, so triangles covering
a wide range of time frames can be identified.

FIGURE 4: WEALTH-LAB, TRIANGLE FORMATION. A triangle formation signifies a top in Apple Computer. Note that we did not draw the trendlines on the chart; the script did this for us automatically.
When the script successfully detects a pattern, it draws lines connecting
the peaks and troughs. The resulting zigzag allows you to visually detect
triangle formations on the chart. Finally, the script draws the two converging
trendlines connecting the peaks and the troughs. These lines act as support
and resistance during the formation of the triangle.
Figure 4 displays a triangle formation that signified a top in Apple Computer in late 1996. Note how prices wound tightly to the very end of the convergence lines, then broke sharply below the formation. After breaking the triangle formation, prices declined so rapidly that a sharp downward gap was produced.
In Figure 5, the script identified a large symmetrical triangle in Wal-Mart,
but this time the formation served as a continuation pattern and not a
reversal pattern. The triangle was established by the peaks and troughs
as shown, but prices kept bouncing off of the two convergence lines well
after the pattern was established. In November 1991. prices briefly broke
above the formation, but reversed back into the triangle. Such a move is
commonly referred to as a "bull trap" and can shake out many
traders banking on a breakout from the pattern. In this case, prices did
indeed break out definitively shortly afterward.

FIGURE 5: WEALTH-LAB, SYMMETRICAL TRIANGLE. Prices bounced between the convergence lines well after the pattern was established. A false breakout and return to the formation was followed by a legitimate breakout shortly afterward.
The code for this script is available on the Wealth-Lab.com website.
Click the "ChartScripts" menu and search for a script named
"Triangles." You can even execute the script on any US stock
directly from the website.
{ Declare variables }
var lstTriangles: TList;
var s: string;
{ Create a list to store detected patterns }
lstTriangles := TList.Create;
{ Set the bar colors to light gray so patterns are seen easily }
SetBarColors( #Silver, #Silver );
{ This function detectes triangle patterns throughout the price
  history, based on a specified price reversal percentage }
function Triangle( Reversal: float; Color: integer ): boolean;
begin
  var Bar: integer;
  var p1, p2, t1, t2, t3, topline, bottomline: float;
  var pb1, pb2, tb1, tb2, tb3, b2: integer;
  Result := false;
  for Bar := 100 to BarCount - 1 do
  begin
{ Determine the two most recent peaks }
    p1 := Peak( Bar, #High, Reversal );
    pb1 := PeakBar( Bar, #High, Reversal );
    p2 := Peak( pb1, #High, Reversal );
    pb2 := PeakBar( pb1, #High, Reversal );
{ and the three most recent troughs }
    t1 := Trough( Bar, #Low, Reversal );
    tb1 := TroughBar( Bar, #Low, Reversal );
    t2 := Trough( tb1, #Low, Reversal );
    tb2 := TroughBar( tb1, #Low, Reversal );
    t3 := Trough( tb2, #Low, Reversal );
    tb3 := TroughBar( tb2, #Low, Reversal );
{ See if this particular pattern was already detected }
    s := IntToStr( pb1 ) + ',' + IntToStr( pb2 ) + ',' +
      IntToStr( tb1 ) + ',' + IntToStr( tb2 );
    if lstTriangles.IndexOf( s ) = -1 then
    begin
{ Pattern not yet detected, add it to the list }
      lstTriangles.Add( s );
{ Test relative positions of peaks and troughs to indicate triangle formation }
      if ( p1 < p2 * 0.995 ) and ( t1 > t2 * 1.005 ) and ( t2 > t3 * 1.005 ) and
        ( pb2 > tb3 ) and ( tb2 > pb2 ) and ( pb1 > tb2 ) and ( tb1 > pb1 ) then
{ Make sure price has moved sufficient level for triangle to reverse }
        if ROC( pb2, #Close, 60 ) > 20 then
        begin
{ Triangle detected - draw the triangle zig zag lines }
          DrawLine( pb2, p2, tb2, t2, 0, Color, #Thick );
          DrawLine( tb2, t2, pb1, p1, 0, Color, #Thick );
          DrawLine( pb1, p1, tb1, t1, 0, Color, #Thick );
          DrawLine( tb3, t3, pb2, p2, 0, Color, #Thick );
{ Determine convergence bar }
          for b2 := tb1 to BarCount - 1 do
          begin
            topline := LineExtendY( pb2, p2, pb1, p1, b2 );
            bottomline := LineExtendY( tb2, t2, tb1, t1, b2 );
            if topline < bottomline then
            begin
              Dec( b2 );
              Break;
            end;
{ Draw convergence lines (dotted) }
            DrawLine( pb2, p2, b2, topline, 0, Color, #Dotted );
            DrawLine( tb2, t2, b2, bottomline, 0, Color, #Dotted );
          end;
{ Return true if the pattern was detected within the last 10 bars }
          if Bar > BarCount - 10 then
            Result := true;
        end;
    end;
  end;
end;
{ Call our triangle function using 4 different reversal percentages.
  This will result in a wide range of triangle patterns being detected in the price history. }
Triangle( 3, #Teal );
Triangle( 5, #Red );
Triangle( 7, #Green );
Triangle( 9, #Blue );
--Dion Kurczek, Wealth-Lab, Inc.
www.wealth-lab.com
![]() NEUROSHELL
TRADER: TRIANGULAR FORMATIONS
NEUROSHELL
TRADER: TRIANGULAR FORMATIONS
The triangular pattern rank described by Giorgos Siligardos in this issue can be easily implemented in NeuroShell Trader using NeuroShell Trader's ability to call external dynamic linked libraries (DLL). Dynamic linked libraries can be written in C, C++, Power Basic, and Delphi.
We've created a ZigZag% and triangular pattern rank indicator that you can download from the NeuroShell Trader free technical support website. A sample chart is in Figure 6.

FIGURE 6: NEUROSHELL TRADER, ZIGZAG% and TRIANGULAR PATTERN RANK INDICATOR. Here's a sample chart in NeuroShell Trader.
After downloading the custom indicators, you can insert them by
doing the following:
1. Select "New Indicator É" from the Insert menu.After downloading the triangular pattern rank indicator, you can easily insert it or combine it with any of our 800+ built-in indicators into a chart, prediction, or trading strategy. In addition, if you decide to use the triangular pattern rank indicator in a prediction or a trading strategy, the parameters can be optimized by the genetic algorithm built into NeuroShell Trader Professional.
2. Select the Custom Indicator category.
3. Select the ZigZag% and triangular pattern rank indicator.
4. Select the parameters as you desire.
5. Select the Finished button.
Users of NeuroShell Trader can go to the STOCKS & COMMODITIES section of the NeuroShell Trader free technical support website to download a copy of any Traders' Tips.
For more information on NeuroShell Trader, visit www.NeuroShell.com.
--Marge Sherald, Ward Systems Group, Inc.
301 662-7950, sales@wardsystems.com
www.neuroshell.com
![]() NEOTICKER:
TRIANGULAR FORMATIONS
NEOTICKER:
TRIANGULAR FORMATIONS
The triangular pattern rank presented in "Mechanically Recognizing Triangular Formations" by Giorgos Siligardos can be implemented in NeoTicker as a formula indicator.
Create a new formula indicator called TPR with two parameters, Type and Value (Listing 1). These two parameters are used in the zigzag calculation. The TPR indicator returns the ranking value when a valid triangular formation is found.
To reconstruct the charts shown in the article using NeoTicker, first
add a daily data series to the chart, and then add the zigzag, volume,
and TPR indicator on the daily chart (Figure 7).

FIGURE 7: NEOTICKER, TRIANGLE FORMATION. The triangular pattern rank formula indicator returns the ranking value when a valid triangular formation is found.
This indicator is also perfect for use in the Pattern Scanner window
of NeoTicker to identify symbols with triangle formations out of a large
selection.
LISTING 1
'Main
zzbot1 := zigzaglowbar (c, 1, param1, param2);
zztop1 := zigzaghighbar (c, 1, param1, param2);
zzmidtop := if (zzbot1 < zztop1, varhhb (c, zzbot1), zztop1);
zzmidbot := if (zzbot1 > zztop1, varllb (c, zztop1), zzbot1);
zzmidtopvalid :=
zzbot1 < zztop1 and
absvalue (c (zzmidtop) - c (zzbot1)) / c (zzbot1) >= (param2
/ 100);
zzmidbotvalid :=
zzbot1 > zztop1 and
absvalue (c (zztop1) - c (zzmidbot)) / c (zzmidbot) >= (param2
/ 100);
zzbot := if (zzmidbotvalid > 0, zzmidbot, zzbot1);
zztop := if (zzmidtopvalid > 0, zzmidtop, zztop1);
x := min (zzbot, zztop);
I := x+1;
xM := I/2;
A := varlinregslope (c, I);
'Regression line
reg := A*x+varlinreg(c, I, 0)-A*(I-1);
'Up And Down Indicators
OK := barssince(x, "data1=0") >= 0;
down := if(OK=0, 0, if(Min(c-reg,0)=0, down(1), Min(c-reg,0)));
up := if(OK=0, 0, if(Max(c-reg,0)=0, up(1),
Max(c-reg,0)));
'slope of up and down indicators
ld := varsum(varpersistcond (OK>0 and c<reg, I), I);
lu := varsum(varpersistcond (OK>0 and c>reg, I), I);
downSlope := varsum((x-xM)*(down-varsum(down,ld)/ld),ld)/
varsum((x-xM)*(x-xM),ld);
upSlope := varsum((x-xM)*(up-varsum(up,lu)/lu),lu)/
varsum((x-xM)*(x-xM),lu);
'Short term swings
SS := varsum(xabove(mov(c,"Simple",5),reg)+
xbelow(mov(c,"Simple",5),reg),I-1);
'Max Retracement
retr := Max(absvalue(c-dhhv2(c,I, "data2+1")),absvalue(c-dllv2(c,I,"data2+1")))/
absvalue(c (zztop) - c (zzbot))*100;
'Volume slope
VolSlope := varsum((x-xM)*(v-varsum(v,I)/I), I)/
varsum((x-xM)*(x-xM), I);
'TPR Forumula
plot1 := if(I >= 10 and I <= 60 and
downSlope >
0 and upSlope < 0 and
retr < 50
and SS >= 3,
if(I>=15 and
I<30,2,0) +
if(I>=30 and
I<=55,1,0) +
if(varrsquare(c,
I)<0.2,2,0)+
if(varrsquare(c,
I)>=0.2 and varrsquare(c, I)<0.5,1,0) +
if(retr<20,4,0)
+
if(retr>=20
and retr<38,3,0) +
if(VolSlope<0,4,0)+1,0);
A downloadable version of this indicators will be available from the Yahoo! NeoTicker user group file area at https://groups.yahoo.com/group/neoticker/.
--Kenneth Yuen, TickQuest Inc.
www.tickquest.com
![]() PROPHET.NET:
TRIANGULAR FORMATIONS
PROPHET.NET:
TRIANGULAR FORMATIONS
Mechanically identifying triangular formations, as described by Giorgos Siligardos in his article this month, is available on the Prophet.Net website to all premium members. No coding is required on the part of the user.
Linear regression, described in detail in the article, is available in seven different varieties within Prophet JavaCharts. The most relevant one to the techniques described by Siligardos is the linear regression trendline, which is similar to Figure 2 in Siligardos's article. Two other indicators, %zigzag and the simple moving average, are mentioned in the article as tools for finding triangle formations, and they are available in the advanced studies suite in JavaCharts, found here:
  Prophet.Net : Analyze : JavaCharts
  https://www.prophet.net/analyze/javacharts.jsp
Click on the Tools menu (which you can also access by right-clicking
anywhere on a chart) and choose "Apply studies" from the
Studies menu item (see Figure 8). To create a chart similar to the one
shown in Figure 4 from the Siligardos article, apply both of these indicators.

FIGURE 8: PROPHET.NET, INSERTING STUDIES. The %zigzag indicator and the simple moving average, which Giorgos Siligardos uses as tools for finding triangle formations, are available through the advanced studies suite in JavaCharts. Here's how to insert the studies.
The Prophet JavaCharts applet shows you the values where you are
pointing, so you can easily calculate the height measurements illustrated
in Figure 4 in Siligardos' article. Figures 5A and 5B in Siligardos'article
used the stock symbol WOR as an example. Figure 9 here reproduces that
chart in Prophet JavaCharts, shown with the two cited indicators.

FIGURE 9: PROPHET.NET, TRIANGLE FORMATIONS. Here's an example of using %zigzag and a simple moving average to identify triangular formations in WOR in Prophet JavaCharts.Drawing trendlines to help define the patterns found is accomplished within JavaCharts by clicking at the desired start point, dragging the mouse to the endpoint, and clicking again. You can change the colors of the trendlines and apply them to either price data, or indicator values (such as volume), or both, as illustrated in Figure 7 of the Siligardos article.
As Siligardos mentions, "The difficult part is figuring out how to tell your software what a triangular shape is!" At www.prophet.net is a product that does exactly this, called Prophet Patterns, which scans (in real time) 3,000 high-volume stocks for completed patterns, including the descending and ascending triangle. You tell Prophet Patterns what you seek (Figure 10), and it will report back to you any stocks that match your parameters. It will also draw the lines on the chart to show you what it "sees" (Figure 11).

FIGURE 10: PROPHET.NET, TRIANGLE FORMATIONS. Select the pattern you wish to scan for in Prophet Patterns.
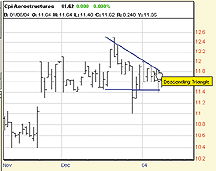
FIGURE 11: PROPHET.NET, TRIANGLE FORMATIONS. Here's an example of using %zigzag and a simple moving average to identify triangular formations in WOR in Prophet JavaCharts.
More information about Prophet Patterns can be found at:
https://www.prophet.net/explore/patternWelcome.jspPremium memberships at Prophet.Net start at $14.95 per month; real-time market data is available for equities, options, and futures. The following link will provide immediate access to all premium studies: https://www.prophet.net/tasc.
--Prophet.netGO BACK
![]() TECHNIFILTER
PLUS: TRIANGULAR FORMATIONS
TECHNIFILTER
PLUS: TRIANGULAR FORMATIONS
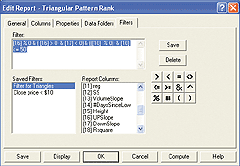
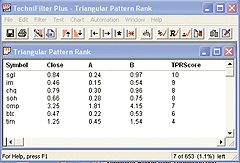
In TechniFilter Plus, we use a "filter report" to scan through a database of stocks to locate triangle patterns and rank them. For simplicity, we generally use a single column per formula (Figure 12), and finally we can decide on the filter(s) to use once the report has finished computing (Figures 13-14).
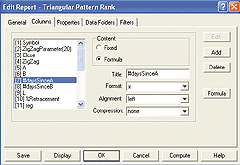
FIGURE 12: TECHNIFILTER PLUS, TRIANGLE PATTERNS. Add columns or formulas In TechniFilter Plus.
FIGURE 13: TECHNIFILTER PLUS, TPR_Filter. Select the pre-saved "Find triangles filter" or build a custom filter from the report columns and tools.
FIGURE 14: TECHNIFILTER PLUS, TPR_Report. Here are the results of the computed report after filtering for triangles and ordering the TPRScore column. Note the issue SGL with a score of 10.
All the formulas used are included with the TechniFilter Plus program.
The various formulas used to build the triangular pattern rank filter report
are included here, based on Giorgos Siligardos' article, "Mechanically
Recognizing Triangular Formations." A sample chart is in Figure
15.
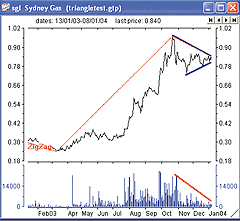
FIGURE 15: TECHNIFILTER PLUS, TPR_SGL. Here's a chart of SGL from a score of 10.
FORMULAS or Columns
Note: Comments are included in the {curly brackets}
  [1] Symbol
  [2] ZigZagParameter(20)
        &1 {Default setting is 20%}
  [3] Close
        C  {Closing Price}
  [4] ZigZag
       Cz[2]  {ZigZag uses parameter in column 2}
  [5] A
       CZ[2]u21  {Point A Latest confirmed ZigZag Valley}
  [6] B
        CZ[2]U31  {Point B Latest confirmed ZigZag Peak}
  [7] #daysSinceA
      Cz[2]u41 {Number of days since A}
  [8] #daysSinceB
     Cz[2]u51  {Number of days since B}
  [9] L
       C
  [10] %Retracement
        (([6]-CN[8])/([6]-[5]))*100 {% Retracement from B}
  [11] reg
[1]: [[8]]y000
[2]: CR[1]Y000-(CU13Y000-CU13)*CD[1]Y000
{Linear Regression  uses the number of days since B}
  [12] SS
[1]: [[8]]y000
[2]: ((CA5-[[11]])U2-TY1)u2F[1]
[3]: (([[11]]-CA5)U2-TY1)u2F[1]
[4]: [2]+[3] {Counts the number of  Short Term swings
above and below the Linear regression line}
  [13] VolumeSlope
        VD[8]Y000 {Calculates the Slope of the linear regression
of the volume uses the # days since B}
  [14] #DaysSinceLow
        [1]: [[8]]y000
[2]: CN'[1]  {# Days since the lowset close SINCE point B}
  [15] Height
        [6]-CY[14]  {Height of the Triangle }
  [16] UPSlope
        [1]: [[8]]y000
[2]: CR[1]Y000-(CU13Y000-CU13)*CD[1]Y000
[3]: IF_THEN(C<[2],C,[2])
[4]: [[14]]y000
[5]: [3]D[4]
{Up Sloping line of Triangle base}
  [17] DownSlope
        [1]: [[8]]Y000
[2]: CR[1]Y000-(CU13Y000-CU13)*CD[1]Y000
[3]: IF_THEN(C>[2],C,[2])
[4]: [3]D[1]
{Down Sloping line of Triangle Top line}
  [18] Rsquare(C  )
        [1]: [[8]]y000
[2]: ( [1]*((&1)*([[11]]))F[1] - ((&1)F[1] * ([[11]])F[1]) )*T / ( (
[1]*((&1)*(&1))F[1] - ((&1)F[1] * T ))  * ( [1]*(([[11]])*([[11]]))F[1] -(([[11]])F[1] * T ) ))
  [19] Bull
       [7] > [8] {Point B is Newer than Point A}
  [20] Bear
       [7] < [8]  {Point A is Newer than Point B}
  [21] Scoring R1
       [1]: [[8]]y000
[2]: (([1]>15 & [1]<30)*(2))+((1-([1]>15 & [1]<30))*(
(([1]>=30 & [1]<55)*(1))+((1-([1]>=30 & [1]<55))*(0))))
{Rule 1 If Triangle formation is between 15 and 30 days score is 2.
Score 1 if it is between 30-55 days}
  [22] Scoring R2
       (([18]<0.2)*(2))+((1-([18]<0.2))*((([18]>=0.2 & [18]<0.5)*(1))+((1-([18]>=0.2
 & [18]<0.5))*(0))))
{Score 2 if Rsquare is less than .02 or 1 if between .2 and .5}
  [23] ScoringR3
(([10]<20)*(4))+((1-([10]<20))*((([10]>=20 & [10]<38)*(3))+((1-([10]>=20
& [10]<38))*(0))))
{Score 4 if Retracement of Triangle formation low is less than 20% or 3 if between 20-38%}
  [24] ScoringR4
       IF_THEN([13]<0,4,0)
{Score 4 if the Linear regression of the volume  slope is negative}
  [25] TPRScore
        [21]+[22]+[23]+[24]
{Adds all the scores together for Ranking purposes}
FILTERS
[1] Filter for Triangles
16] % 0 & ( [16] > 0  & [17] < 0) & (([10]  % 0)  & [10] <= 50)
Visit the new home of TechniFilter Plus at www.technifilter.com to
download these reports and formulas.
--Benzie PikoosGO BACK
Brightspark
Tel +61 8 9375-1178, sales@technifilter.com
www.technifilter.com
![]() TRADE
NAVIGATOR: VOLUME-WEIGHTED MOVING AVERAGE (VWMA)
TRADE
NAVIGATOR: VOLUME-WEIGHTED MOVING AVERAGE (VWMA)
Within many trading techniques, there is sometimes a need for moving averages that become more responsive during periods of higher volume. The way to accomplish this is to weight a normal moving average with the volume for the period specified (Figure 16).
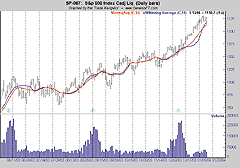
FIGURE 16: TRADE NAVIGATOR, VOLUME-WEIGHTED MOVING AVERAGE. Here's a comparison of the simple (nonweighted moving average shown in red) and the volume-weighted moving average (in blue). In higher periods of volume, the VWmoving average tends to be more responsive to price action.
The TradeSense formula for the volume-weighted moving average is
shown in Figure 17. Enter this formula into Trade Navigator by doing the
following: Click on Edit, and then Traders Toolbox. Continue to the Functions
tab of the Traders Toolbox, and click on New (for new function). Now type
the formula shown in Figure 17 into the Function window.
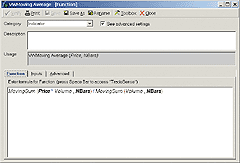
FIGURE 17: FORMULA FOR VOLUME-WEIGHTED MOVING AVERAGE. The volume-weighted moving average sums the volume multiplied by the price for each day in the average (NBars), and then divides this value by the total volume in the averaged period (NBars).
Once the formula is entered, you will need to verify the formula.
Once it has been verified, you must assign default values to the inputs
that were used (Figure 18) in the Inputs tab.
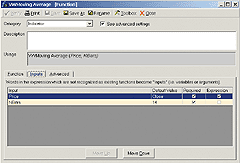
FIGURE 18: INPUTS FOR THE VOLUME-WEIGHTED MOVING AVERAGE. Simply set the default values to the ones shown above.Defining the inputs:
Price--This is the securities price that you are taking an average of, such as the closing value of a security.
NBars--This input is the number of bars or time span used for the average.
A GLB (Genesis Trade Navigator library file) for the VWMA will be available upon request. Please contact Genesis Technical Support either by email at Support@GFDS.com or by telephone at (719) 884-0254.
--Chad Noble
GFT Strategic Development
Genesis Financial Technologies
CNoble@GFDS.com
All rights reserved. © Copyright 2004, Technical Analysis, Inc.
Return to March 2004 Contents
