Looking For Divergence Clues
Volume Divergence
by Hal Masover
Divergences in volume and price give clues to future price movement.
One of the first things I learned about trading was to search for divergences. Briefly, divergence simply refers to the circumstance of price going one way but not being confirmed by any number of possible other confirming indications.
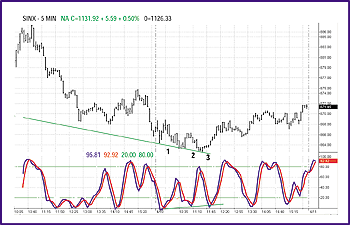
The first one I learned to use and still like is stochastic divergence. This was developed by George Lane and is available on virtually any charting software. In Figure 1, I have reproduced stochastic divergence on a five-minute chart of the Standard & Poor's 500 index from April 10, 2003.
See how the price makes three consecutive lower lows from the previous afternoon low labeled 1, 2, and 3? Now look at the stochastic indicator right below the chart. The indicator makes higher lows over this same time. This is divergence.
Lane calls it convergence because the two trendlines I have drawn, the down trendline on the price chart and the up trendline on the stochastic indicator, will converge if the lines are extended further out. Seems reasonable, even accurate, and too much bother for me to remember that this phenomenon is called convergence at lows and divergence at highs. The term "divergence" is used throughout the trading community simply to indicate that not all the things you are looking at are going in the same direction.
You could look at the Dow Jones Industrial Average (DJIA) and note that it is making new lows while the Dow Jones Transport Average (DJTA) is not. You might note that April gold futures make new highs while August gold futures make a lower high. The number of divergences may only be limited by your imagination. The question is, what is the utility of the divergences you are looking at? Some are clearly more valuable than others.

FIGURE 1: STOCHASTIC DIVERGENCE. Here, you see falling prices accompanied by higher stochastics. This suggests there might be a divergence in prices, which, as you can see, did take place.
...Continued in the April issue of Technical Analysis of STOCKS & COMMODITIES
Excerpted from an article originally published in the April 2004 issue of Technical Analysis of STOCKS & COMMODITIES magazine. All rights reserved. © Copyright 2004, Technical Analysis, Inc.
Return to April 2004 Contents