Measuring Autocorrelation
Come Here Quick, Durbin Watson
by Ron McEwan
Here's how you can use the Durbin Watson statistic to measure the autocorrelation of two securities.
One of the most powerful statistical tools traders have at their disposal is the ability to measure the correlation between two sets of time series data. There are many approaches to this. One is to measure the relationship of stock prices (usually the closing prices). Another method, common among portfolio analysts, is to measure the correlation of the returns (daily, weekly, or monthly) of the underlying data. The idea is that you would not want too many securities in the portfolio that are highly correlated with each other (you do not want the same kind of eggs in your basket). Yet another method is to measure the correlation of the residuals of a regression line that has been applied to the data. This is referred to as autocorrelation.

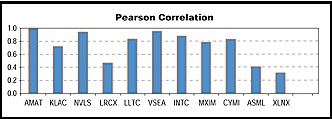
FIGURE 1: PEARSON CORRELATION. Here is the 60-day Pearson correlation coefficient for 10 stocks selected from Market Topology as having the highest 12-month correlation to AMAT.
...Continued in the April issue of Technical Analysis
of STOCKS & COMMODITIES
Excerpted from an article originally published in the April 2004 issue of Technical Analysis of STOCKS & COMMODITIES magazine. All rights reserved. © Copyright 2004, Technical Analysis, Inc.
Return to April 2004 Contents