STOCHASTICS
For many technicians, stochastics are the first real oscillator to be encountered when embarking on the study of technical analysis. Unlike some of the more common-sounding concepts in technical analysis, terms like support and resistance, breakout and breakdown, trading range, relative strength, and pullback, a term like stochastics lets an acolyte technician know he or she has truly entered a different field of knowledge with its own rules, customs, mores, and in-group jargon.
What are stochastics? George Lane, in an informative and entertaining article for Technical Analysis of STOCKS & COMMODITIES back in 1984, wrote a brief primer on using what he called "Lane's Stochastics":
This method is based on the observation that as price decreases, the daily closes tend to accumulate ever closer to their extreme lows of the daily range. Conversely, as price increases, the daily closes tend to accumulate ever closer to the extreme high of the daily range.
Lane's article is a classic discussion of the components of the stochastic oscillator. He writes about %D ("in working with %D it is important to remember that there is only one valid signal") and %K separately as well as together; he discusses divergences between %D and price, crossovers with %K crosses %D, a pattern he calls the "hinge," warnings about sharp reversals and extreme values in %K, and setups, failures, and %K divergence.
Nowadays, most technical traders think of stochastics as described by Steven Achelis in his essential book Technical Analysis From A To Z: essentially, as the two lines %K and %D, with %D being a moving average of %K. But the "Lane's Stochastics" article remains an excellent source for information about the different ways that the stochastic process can be exploited by traders and investors operating on a variety of time frames.
The formula for stochastics is more straightforward than it may seem. In his book Technical Analysis Of The Futures Markets, John Murphy provides the formula for the %K and %D values as follows:
%K = 100 [ (C - L5) / (H5 - L5) ]where C is the latest close, L5 is the lowest low for the last five days, and H5 is the highest high for the same five days.
%D = 100 X (H3/L3)
where H3 is the three-day sum of (C ? L5) and L3 is the three-day sum of (H5 - L5).
As an oscillator, stochastics range between values of zero and 100%. As Achelis notes:
A reading of 0% shows that the security's close was the lowest price that the security has traded during the preceding x time periods. A reading of 100% shows that the security's close was the highest price that the security has traded during the preceding x time periods.
There are three main ways contemporary traders tend to use stochastics. The first method is to buy the market when the oscillator (%K or %D) falls below a certain oversold level -- usually set at 20 or 30% -- and then advances beyond that level. Conversely, the market is sold when the oscillator (%K or %D) rises above a certain overbought level -- usually set at 70 or 80% -- and then falls below that level.
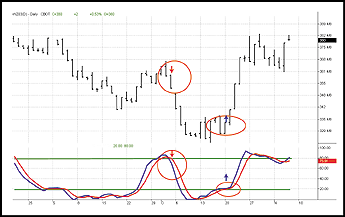
Consider the chart of December wheat in Figure 1. The stochastic oscillator shown in the lower pane began rising after September 22 from an oversold level below 20. The oscillator rose as prices for December wheat rose going into October. In October, however, the stochastic oscillator entered overbought territory above 80 and, shortly afterward, rounded over and began moving down, eventually passing below the 80 level. Prices for December wheat fell from over $3.55 to under $3.30 in less than five days.

FIGURE 1: THE STOCHASTIC OSCILLATOR. The indicator anticipates consecutively bearish and bullish turns in December wheat.
Something similar took place to the bullish side near the end of October. The stochastic emerged from an oversold position around the 20th day of the month while December wheat prices -- to all appearances -- were still forming some sort of consolidation. The day after the stochastic oscillator moved from the oversold area, December wheat prices broke free from the consolidation to the upside and moved from about $3.35 to nearly $3.70 - again, in less than five trading days.
A second method for using stochastics relies on crossovers. Specifically, the market is bought when the %K rises above %D, and the market is sold when %K falls below %D. The same chart of December wheat can be used to illustrate this principle as well. Note how as prices are moving from the overbought level there is a crossover in which the blue line (%K) crosses under the red line (%D -- the moving average of %K). The same thing is seen when prices are preparing to move higher; %K crosses above %D just as the stochastic itself is rising from oversold territory.
A third method for using stochastics involves divergences. When prices make a high, then follow up with a higher high, the stochastic oscillator should do the same. If the oscillator refuses to make a higher high (or lower low) when price action does, then a divergence has occurred that may anticipate a significant reversal in trend.
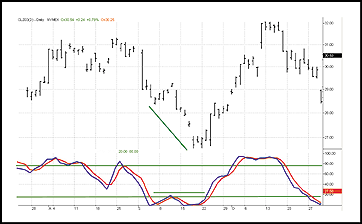
In the chart of December crude oil futures in Figure 2, note how prices were moving down strongly throughout September. There was a low in the first week of September, and then a much lower low in the third week of the month. At the same time, however, the stochastic oscillator made two trough lows at approximately the same level. The stochastic refused to confirm the lower low made by prices. This is an example of a positive divergence ("positive" referring to the fact that the indicator is making bullish intimations while prices remained bearish) from which higher prices can be expected. Sure enough, December crude bottomed in the third week of September and by the following week was rallying strongly.

FIGURE 2: DIVERGENCE. This positive divergence in December crude oil futures in September set the stage for a powerful rally in October.
In the same way that virtually all technical indicators are derivatives of price and time, technical indicators are also an attempt to reflect and measure the complex psychology of thousands or millions of people simultaneously seeking gains in the market. In his book Trading For A Living, Alexander Elder does an excellent job of making the connection between the stochastic oscillator and the behavior of traders and investors:
Stochastic measures the capacity of bulls or bears to close the market near the upper or lower edge of the recent range. When prices rally, markets tend to close near the high. If bulls can lift prices up during the day but cannot close them near the top, stochastic turns down. It shows that bulls are weaker than they seem and gives a sell signal.
Daily closes tend to occur near the lows during downtrends. When a bar
closes near its high, it shows that bears can only push prices down during
the day but cannot hold them down. An upturn of stochastic shows that bears
are weaker than they appear and flashes a buy signal.
-David Penn, Technical Writer
Learn more about stochastics!
Achelis, Steven B. [2000]. Technical Analysis From A To Z, McGraw-Hill.
Elder, Alexander [1993]. Trading For A Living, John Wiley &
Sons.
Evens, Stuart [1999]. "Stochastics," Technical Analysis of STOCKS
& COMMODITIES, Volume 17: September.
Hartle, Thom [1990]. "Stochastics And Long-Term Trends," Technical
Analysis of STOCKS & COMMODITIES, Volume 8: January.
_____ [1991]. "Comparing Indicators: Stochastics %K Versus Williams'
%R," Technical Analysis of STOCKS & COMMODITIES, Volume 9: June.
Keel, Cynthia, and Heidi Schmidt [1987]. "Using Stochastics," Technical
Analysis of STOCKS & COMMODITIES, Volume 5: July.
Kepka, John F. [1985]. "Day Trading With Stochastics," Technical
Analysis of STOCKS & COMMODITIES, Volume 3: January.
Lane, George C. [1984]. "Lane's Stochastics," Technical Analysis
of STOCKS & COMMODITIES, Volume 2: March.
Lundgren, David [1993]. "Stochastics Indicators And Trading," Technical
Analysis of STOCKS & COMMODITIES, Volume 11: March.
Morris, Greg [1991]. "Candlesticks And Stochastics," Technical Analysis
of STOCKS & COMMODITIES, Volume 9: August.
Murphy, John J. [1986]. Technical Analysis Of The Futures Markets,
New York Institute of Finance.
Schwager, Jack [1986]. "How Useful Are Stochastics For Trading?" Technical
Analysis of STOCKS & COMMODITIES, Volume 4: May.
Originally published in the April 2004 issue of Technical Analysis of STOCKS & COMMODITIES magazine. All rights reserved. © Copyright 2004, Technical Analysis, Inc.
Return to April 2004 Contents