April 2004 Letters To The Editor
The editors of S&C invite readers to submit their opinions and information on subjects relating to technical analysis and this magazine. This column is our means of communication with our readers. Is there something you would like to know more (or less) about? Tell us about it. Without a source of new ideas and subjects coming from our readers, this magazine would not exist.
Address your correspondence to: Editor, STOCKS & COMMODITIES, 4757 California Ave. SW, Seattle, WA 98116-4499, or E-mail to editor@traders.com. All letters become the property of Technical Analysis, Inc. Letter-writers must include their full name and address for verification. Letters may be edited for length or clarity. The opinions expressed in this column do not necessarily represent those of the magazine. -Editor
CANDLESTICKS REVISITED
Editor,
While I disagree with the importance placed on a single tall white candlestick line in Stephen Bigalow's article in the February 2004 issue ("Stop-Loss Procedures Made Easy"), I am glad he touched on the importance of using stops.
In all of my training material, I stress that while candlesticks give many timing advantages, the trader must always take into account risk and reward. One of my Nison Trading Principles (my 13 most important trading concepts) is, "Even a perfect candle signal does not equal a good trade! One must always judge the potential trade's risk-reward." Not understanding this is probably one of the most common mistakes made by those new to candlesticks.
By using a protective stop, we harness one of the major strengths of technical analysis. To wit: fostering a sound money management approach to trading. A stop means that there is a price at which the position is wrong. As the Japanese proverb says, "When you are riding a dead horse, it is best to dismount."
Steve Nison, CMT
Candlecharts.com
Steve Nison is the author of Japanese Candlestick Charting Techniques and The Candlestick Course.--Editor
FOURIER ANALYSIS REDUX
Editor,
I want to react to Bill Cooke's letter to the editor on the topic of Fourier analysis in the February 2004 S&C (page 10). The question was about code implementation of Fourier transform. Fourier analysis breaks down the price series into constituent sinusoids of different periods, and I understand the usefulness of this technique when the signal's frequency content is stationary.
However, Fourier analysis has a serious drawback concerning time series. In transforming to the frequency domain, time information is completely lost. As anyone can notice, financial time series are of discontinuous character. Clustering of volatility and non-Gaussian behavior of price jumps make them nonstationary. These characteristics are the most important part of a signal. When it comes to detecting them and being able to tell when an event took or will take place, Fourier analysis is not suitable.
In an effort to correct this deficiency, the short time Fourier transform (STFT) maps the series into a two-dimensional function of time and frequency but limits the time window to a particular size, which cannot vary to determine more accurately either time or frequency.
Wavelet analysis, in contrast, uses approximating functions that are localized in both time and frequency space. It is the breaking up of the time series into shifted and scaled versions of an original mother wavelet. This unique characteristic makes wavelets particularly useful for price series analysis. Indeed, the burgeoning popularity of wavelets makes them an indispensable addition to a more classic collection of tools.
Philippe Lonjoux
Kanata, ON
Canada
Our response to Bill Cooke's letter about Fourier analysis referenced past Fourier articles published in Technical Analysis of STOCKS & COMMODITIES, The Traders' Magazine. Some of the articles contain BASIC code that compensates for data trend and start/end point differences. The data is made stationary prior to processing with a discrete fast Fourier transform (FFT). The procedure works very well to determine what cycles, if any, are present in historical data.
The purpose of the Fourier analysis is to transform historical data from time to frequency domain, eliminating the time information. By looking only at frequency information, it is easy to see the relative size of cycles and how often they occur in the original data. This information can be used to design and tune time series filters. Fourier analysis is not usually suitable for forecasting.
For shorter data samples, we have also published code for maximum entropy spectral analysis (MESA). MESA uses a different algorithm to detect cycles in data and can be used with less historical data. The maximum entropy method (MEM) has been used to forecast cyclical markets with some success.
The other techniques you mention sound interesting. Please consider submitting an article for possible publication in this magazine. --Jack K. Hutson, Publisher
ZIGZAG AND HEIKIN-ASHI
Editor,
The article by Spyros Raftopoulos, "The ZigZag Trend Indicator" (November 2003 S&C), and Dan Valcu's recent article, "Using The Heikin-Ashi Technique" (February 2004 S&C), prompted me to look at combining the two approaches.
I have been using zigzag to define my primary trading range. However, as pointed out by Raftopoulos, the last leg of the zigzag poses a problem since it is active. Therefore, you need some way of validating that the last leg's direction is correct. After experimenting with Valcu's methods (with a little modification), the heikin-ashi technique seemed to provide an artificial price with less noise. By putting the two together, the following modest effort seems to provide good validation:
METASTOCK INDICATOR
BUILDER code
N:=INPUT("NUMBER OF PERIODS",0,10000,100); {N IS THE HIGH TO LOW OR LOW TO HIGH FOR THE LATEST ZIGZAG MOVE.}
haOPEN:=REF((C+O)/2,-1);
haCLOSE:=(O+H+L+C)/4;
HA:=SUM(haCLOSE-haOPEN,N);
RSQ:=RSQUARED(HA,N);
IF(RSQ>=.8,+1,IF(RSQ<=.2,-1,0))
Summing (haCLOSE-haOPEN ) creates an artificial price plot for the latest zigzag move. The r-squared indicator gives a strength of trend indication.
Finally, an r-squared number above or equal to 0.8 returns +1. A
number below or equal to 0.2 returns a -1, with all other numbers returning
zero. This gives a good visual of the trend strength. I sincerely hope
you or other readers will find this useful.
Kenneth L. Kesler
Missouri City, TX
Thank you for sharing your findings.--Editor
ESTIMATION OF HURST EXPONENT
Editor,
Estimation of the Hurst exponent (Letters To S&C, February 2004) is accomplished using a technique called "R/S analysis," which was developed by Benoit Mandelbrot and several co-authors in a series of papers in various hydrology journals (principally Water Resources Research) in the late 1960s and early 1970s.
A detailed explanation of the methodology along with an example of its use in estimating H for 200 stocks on the New York Stock Exchange may be found in my Ph.D. dissertation, "Long Term Dependence In Common Stock Returns: Evidence And Effect On Risk-Return Models" (Georgia State University, 1975), which also contains complete references to all of the Mandelbrot papers. Any college library should be able to order a copy of the dissertation. The hydrology journals should be available at any university with an engineering school.
R/S analysis requires very long data series to produce useful results and is computationally intensive. At one time I had a set of Fortran programs to perform R/S analysis on stock returns, but I'm afraid they have long since disappeared. An accomplished programmer with a good mathematical background could easily replicate them from the description in the dissertation. For the nonmathematically inclined, R/S analysis is probably best avoided.
Myron T. Greene
Roswell, GA
HOLDING OVERNIGHT POSITIONS
Editor,
Regarding the article "Holding Overnight Positions" by Anthony Trongone in the January 2004 S&C, I have the following comments.
I appreciate the insight the article provides and I have benefited as a result. Further, I also have an academic interest in ascertaining the sources for opinions referred to as traditional. The author's Figure 1 indicates that falling prices/expanding volume is traditionally considered bullish, and falling prices/contracting volume is traditionally considered bearish. (By the way, Figure 1 appears to be in conflict with comments on page 19 where the author writes: "To sum, the findings were not supportive of this traditionally bullish indicator" [my italics].)
This appears to be in conflict with the following highly regarded authorities on technical analysis: According to John Murphy's Technical Analysis Of The Financial Markets (page 165): "In a downtrend, the volume should be heavier during down moves and lighter on bounces. As long as that pattern continues, the selling pressure is greater than buying pressure and the downtrend should continue."
According to Martin Pring's Technical Analysis Explained (page 283): "Either upside volume is failing to expand sufficiently or volume during the decline has begun to expand excessively on the downside.... Both are bearish factors."
According to Robert Edwards & John Magee's Technical Analysis Of Stock Trends (page 24): "Volume goes with the trend.... In bear markets, turnover increases when prices drop and dries up as they recover."
If these unanimous sources are correct, it appears that the author's research would document consistent exception of actual market movement to traditional expectations (at least for the period tested). It would be very interesting to hear from the quoted authors as to why such a phenomenon might occur.
Ken Kautz, via email
Anthony Trongone replies:
With such a venerable lineup, it is not easy to take an antagonistic position, especially one that throws cold water -- at least temporarily -- on the long-held theory that rising prices with rising volume (RPRV) is bullish, and rising prices with falling volume (RPFV) is bearish. However, this "traditional wisdom" came long before the advent of the computer, direct-access trading, as well as a growing exposure to international trading.
This is certainly a different era; the widespread availability of direct access trading has given us a longer trading session, a smaller price range to trade between, as well as the opportunity to take positions with no restrictive downtick rule (ETFs). These new developments are instrumental, but the most impressive departure from collective wisdom comes from the expanding role of trading in the "hours of darkness."
Figure 1 shows the extent to which the overnight trading session, rather than the regular trading day, is dictating action. In 2001, the overnight trading session was responsible for 11.61% of the overall loss ($2.26 of $19.47); the percentage share grew twice as large the next year, whereas in 2003, the triple Qs rose $12.09, of which $7.31 of the gain came after the close of trading. Apparently, these are active traders with a different mindset who are capable of generating a price change in a less active trading environment.

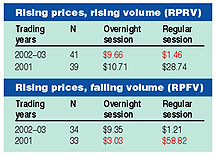
FIGURE 1: PERFORMANCE DIFFERENCES. In 2003, 61% of the yearly dollar increase was in the overnight session.
Recently, this pattern of strength is becoming more noticeable. In the 60 trading days from 10/31/2003 to 1/28/2004, the dollar gain in the triple Qs was $1.71; however, the gain during the overnight session was $3.22, clearly overshadowing the performance of the regular session. With such a growing discrepancy, it is apparent that traders are placing more emphasis on the overnight session rather than focusing on yesterday's overall change in price in relation to trading activity.
In my article, I said that "the falling price with stronger volume scenario was somewhat supportive of traditional wisdom." But the combination of falling prices with contracting volume "was the poorest performer with as many advancing as declining days... the overall profit was unimpressive." In reviewing the figure, I show a trading condition with "negligible performance"; therefore, it was "not supportive of this traditionally bullish indicator."
Since my emphasis was on each combination of rising prices, I will confine our discussion to the profitable side of my overnight system. In reviewing Figure 2, the average performance return for the RPRV condition in 2002/03 was bearish, whereas it was bullish for the RPFV condition. A cursory glance will show that much of the performance came from the overnight session.

FIGURE 2: REVERSAL OF FORTUNE. In the 2002-03 period, traditional wisdom was not supported in an environment of rising prices with aggressive trading activity.
Although my findings are not supportive of conventional theory,
there are many successful technicians who are receptive to taking a position
in the opposite direction when there is a strong price increase along with
an aggressive change in trading activity. This, then, is not a departure
from traditional thinking, as many relative strength indicators envision
an eventual convergence toward conformity.
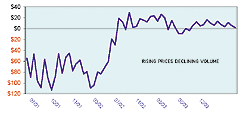
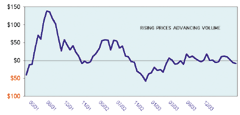
Considering that even the most rewarding strategies are susceptible to episodes of failure, you can produce remarkable effects by tracking the profitability of a trading system. For example, in looking at the two charts of rising prices (Figures 3A and 3B), you can see a moving average for tradable signals. Since the RPRV pattern of performance is trending downward and the RPFV has been lingering in a narrow range in positive territory, each demonstrates a most discouraging account of traditional wisdom.

FIGURE 3A: RPRV STRATEGY. Here's an example of an eight-day moving average tracking the performance of a 100-share purchase. Since August 2001, notice the progressive fall in the performance of the triple Qs.

FIGURE 3B: RPFV STRATEGY. Here's an example of an eight-day moving average tracking the performance of a 100-share purchase. Since 2001, there has been a sustainable gain by taking a long position in the triple Qs.
LEARNING DISCIPLINE IN TRADING
Editor,
I started reading S&C in the early 1990s. I have every issue from that date. I started learning technical trading just like everyone else, with no knowledge but plenty of desire. I have come a long way and now consider myself reasonably competent, thanks to your magazine and years of study, writing rules, backtesting, and of course trading. I now trade successfully with a set of rules I have developed over the years, but am always looking for ideas to consider and learn about. I look forward to each new issue for ideas and your "Opening Position" comments each month. Your comments are always worth my time to read.
Like most people, I have always assumed that somebody else has a better way to trade. I have attended one trade seminar introduction, but was not willing to shell out the money for the training. I have bought a couple of trade methods for a few hundred dollars each, but soon learned they did not work. Over the years, I have heard so much about Turtle Traders that I almost bought the system last year. I applaud David Penn for his recent writeup (Websites For Traders, "OriginalTurtles.org") and the original Turtles for going public with their system. I downloaded the rules and was shocked that I almost bought something so simple.
I have become convinced that almost any system, simple or complex, will make money, but the key is discipline, just as the original Turtles discussed. Trading For A Living by Alexander Elder is the one book I refer to the most. My lack of discipline and trusting my own rules cost me during the downturn, but I have also made a lot of money over the years. Every set of rules I now print out has the words "Discipline, Not Conviction" at the top - even at my Yahoo! web page. Every time I think I know where the market is going and don't follow my own trading rules, I get whacked. The real secret to technical trading is having the discipline to follow one's own rules, not the rules themselves.
Jon Rodgers, via email
Sunrise Beach, TX
CHARTING SOFTWARE FOR MAC
Editor,
I have a Mac. Is there any charting software of the level of MetaStock
that you would suggest? I use Mac OS X.
JM, via email
Some of the products for the Mac that we have reviewed in our magazine over the years include:
Behold! (Investors Technical Services, Inc.) Personal Hotline/Personal Analyst/Pro Analyst (Trendsetter Software) ProTA (Beesoft) PowerAnalyzer (Ino Global Markets) Wall Street Investor (Comstar Concepts Inc.) Investor/RT (Linn Software)
Of these, the most recently reviewed was Behold!, which appeared
in our January 2002 issue. We haven't yet reviewed any charting software
that runs under OS X.
You can use the search engine at our website to locate any of these reviews, which can be purchased from our Online Store at https://store.traders.com/.
You can search for other Mac-based products -- or products designed to run on either platform -- at our Traders' Resource database of products and services at our website at:
https://technical.traders.com/Products/catsearch.asp?cat=120
There, in the first field, select "Mac" as the operating system using the pulldown menu, then scroll down and click "Search," and you will return many more products. These products have been entered into this database by their vendors as products that can run on a Mac. You can click on the individual product entries to view details for contact information. Of course, not all of these products are going to be comparable to what MetaStock can do.--Editor
Back to April 2004 Contents