June 2004 Letters To The Editor
The editors of S&C invite readers to submit their opinions and information on subjects relating to technical analysis and this magazine. This column is our means of communication with our readers. Is there something you would like to know more (or less) about? Tell us about it. Without a source of new ideas and subjects coming from our readers, this magazine would not exist.Address your correspondence to: Editor, STOCKS & COMMODITIES, 4757 California Ave. SW, Seattle, WA 98116-4499, or E-mail to editor@traders.com. All letters become the property of Technical Analysis, Inc. Letter-writers must include their full name and address for verification. Letters may be edited for length or clarity. The opinions expressed in this column do not necessarily represent those of the magazine. -Editor
SPREADSHEETS
Editor,
The April 2004 issue of S&C contained an article called "Trend
Quality Indicator." I would like to see an update of this article in your
magazine showing the formulas using Excel.
Wolfgang Tilch, via email
Thank you for your interest. Unfortunately, we cannot always include formulas for Excel. Perhaps other readers who have created a spreadsheet will be able to share it with you. You may wish to post a message to this effect at our Message Board at https://message-boards.traders.com/.-Editor
BONUS ISSUE
Editor,
In your February 2004 issue you had a review of all the different
direct-access brokers, professional platforms, and institutional platforms.
I could not find it on your website to order it. Can you give me the URL
or other ways to get this article?
Eric Bloemendaal, via email
That was actually the Bonus Issue you saw that in, which is only available to subscribers, and it was our Readers' Choice Awards, not a review. To obtain a copy of our Bonus Issue (not available on the web), contact our subscription department at Circ@Traders.com or 800-Technical for a subscription, which will allow you to receive a Bonus Issue. Thank you for your interest.-Editor
ELLIOTT WAVE COUNTS
Editor,
I have a question regarding "A Developing Depression" in the March 2004 S&C. In Figure 1 in that article, author Robert Prechter shows wave V being longer than wave III. By definition, and even in Prechter's book Elliott Wave Principle, wave III is the longest wave. It appears his wave count is incorrect.
I suspect Prechter might call this an extended wave V. His book is
vague on extended waves. I would like his explanation on Figure 1.
Steve Gibbons
Coppell, TX
Robert Prechter replies:
There is no rule that the third wave must be the longest, nor does
my book say so. The third wave can't be the shortest. See Elliott Wave
Principle, 20th Anniversary Edition, page 30 (New Classics Library).
TRADERS' TIPS FEEDBACK
Editor,
I agree with your recent letter-writer who said to eliminate the
formulas in your Traders' Tips section and put them at your website instead.
I would rather see you use the space discussing individual traders and
what they do to make money trading.
Dick Streich, via email
It's not a question of space allocation, but rather, we added more pages to the magazine to include the tips.-Editor
MORE TRADERS' TIPS FEEDBACK
Editor,
Regarding the letter from R.B. Millar that appeared in the March 2004 S&C, I would like to provide my comments. As a reader for several years, I have seen the Traders' Tips section expand. I believe it's an essential part of S&C that is unique among print publications. I'll reiterate what you stated in response to that letter: While I won't be typing the code from the magazine, I do indeed peruse the code listing to get a feel as to how the technique is programmed. Even if I don't implement a technique fully, I might get ideas or solutions on a system that I might be developing elsewhere.
I do have to side with Mr. Millar's observation, though, that the
Traders' Tips section is quite lengthy. I believe code for the most popular
products, such as TradeStation, MetaStock, eSignal, and Wealth-Lab, should
be included in the magazine. The remaining products only warrant a reference
to your website and not a code listing or detailed textual explanation.
I believe you're concerned about cost efficiency in producing S&C each
month and balancing content amongst a wide reader base, and I'm concerned
about extra pages that I merely skip over. Reducing the Traders' Tips section
to focus on these main products as I suggested will indeed be an improvement
on all fronts.
Bill Strayer, via email
Thank you for your feedback and suggestions. We've heard from several readers who say they find it interesting to peruse the code. However, we'd rather not limit our focus to the larger and more popular software, because we feel other programs may have contributions to make and may serve some readers' needs. We try to provide coverage of many different programs in our magazine. We have, though, already cut back the Traders' Tips section to one topic instead of two. -Editor
CANDLESTICK FILTERING
Editor,
The Working Money article "Candlestick Filtering" by Ashwani Gujral
that appeared in the April 2004 STOCKS & COMMODITIES was top-notch.
One of the best in years.
Ron Munzenrieder
Naples, FL
MECHANICALLY RECOGNIZING TRIANGULAR FORMATIONS
Editor,
I read "Mechanically Recognizing Triangular Formations" from the
March 2004 S&C with great interest. However, the Tpr exploration formula
(for MetaStock) that I obtained from your Traders' Tips section generates
the following error message: "Period out of valid range in LinRegSlope()
function." I am wondering if you could help.
Eddie Chu, via email
MetaStock wrote and contributed that tip to our magazine, so please contact MetaStock at www.MetaStock.com for technical support on MetaStock products.-Editor
TECHNICAL ANALYSIS EMPLOYMENT
Editor,
Do you receive and post job openings for technical analysts? If not,
can you recommend any other websites/publications where I can go to look?
Phil Szczesniak
Colorado Springs, CO
No, sorry, we don't post industry job listings. We don't know of any classifieds listings specifically tailored to the technical analysis field, but we might suggest exploring the Market Technicians Association at www.mta.org (admin@mta.org), which is a professional organization for market analysts, with opportunities for networking and attending seminars and other resources. You could also try checking a general online job listings resource such as Monster.com and search in the finance area, or try contacting brokerage firms, market analysis and trading firms, or investing newsletters/websites directly. Good luck.-Editor
PORTFOLIO RISK MANAGEMENT
Editor,
Many of us traders/investors, to one degree or another, either manage our own portfolio of funds or stocks or have influence over our professionally managed portfolios. I am concerned about sizable pullbacks (more than 5%) that can occur in the Dow/Nasdaq/S&P markets that I would like to have some downside protection over. Traditional thinking is that diversification and portfolio reshuffling are the answer, but as we all learned several years ago during the market correction, that's not realistic; all investment vehicles went down together.
I'd like to see articles from experienced traders on how to manage
downside risk in your portfolio, without having to reshape the portfolio
or without putting everything into cash. I'm thinking about using options
or futures, but neither I nor my planner are experienced in this area,
and that may be influencing why we're not using that as a risk management
tool. Or maybe I'm wrong and the buy and hold portfolio should be left
to drop?
Craig Stangland, via email
We often explore risk management in our magazine, since that is such a crucial part of successful trading. Try searching for past articles on this topic - using keywords such as portfolio risk, managing risk, position risk, volatility, options trading, and money management (or more specific terms) - at our website at www.Traders.com. Here are a few articles to mention:
Demkovich, Joe, and Eugene Theriot [2000]. "Increasing Return With Covered
Calls, " Technical Analysis of STOCKS & COMMODITIES, Volume
20: January.
Fullman, Scott H. [1994]. "Managing Risk With Options," Technical
Analysis of STOCKS & COMMODITIES, Volume 12: May.
Gard, Richard [1993]. "Active Risk Management: Using Options To Manage
A Position," Technical Analysis of STOCKS & COMMODITIES, Volume
11, December.
Gopalakrishnan, Jayanthi [2003]. "Managing Money & Risk: Robert
Deel," interview, Technical Analysis of STOCKS & COMMODITIES,
Volume 21: October.
Guppy, Daryl [1999]. "Exploiting Positions With Money Management,"
Technical Analysis of STOCKS & COMMODITIES, Volume 17: September.
See also our monthly column by Tom Gentile, chief options strategist at Optionetics, which is dedicated to teaching investors how to minimize their risk while maximizing profits using options.-Editor
INVERSE FISHER TRANSFORM
Editor,
Thank you for sending a complimentary copy of Technical Analysis
of STOCKS & COMMODITIES. The article by John Ehlers in that issue
(May 2004) on the inverse Fisher transform immediately intrigued me. However,
on closer examination I found the article disappointing. I'm reporting
on those disappointments for your information. Perhaps the author will
be interested also. To my mind, the article fell short in several respects:
1. It claims that the transformation of various indicators via the inverse Fisher transform (IFT) will produce indicators with unambiguous buy/sell signals. Examples for the RSI and cyber cycle indicators are shown in the article. However, the article does not demonstrate that the reduced ambiguity improves the performances of the RSI and CC indicators. My guess is that their original performances are comparable to that of their corresponding IFT indicator, which would mean the value added by the Ift indicator is possibly negligible.2. The RSI and CC examples shown in the article suggest that the IFT always gives profitable buy/sell signals, but both examples are for rising markets. It would have been more instructive to have seen examples for rising, falling, and sideways markets.
3. For the rising market examples shown, the IFT buy/sell signals apparently triggered profitable trades, but it's not clear they would have outperformed a buy and hold strategy after transaction costs. If they did outperform, it's not clear that their additional gain would be worth the opportunity cost of constructing and monitoring the IFT indicator. I believe that this criticism might apply to the RSI and CC indicators also.
Other more minor flaws in the article that I found aggravating
were:
1. The IFT in Equation 2 does not follow from the FT in Equation 1. Equation 2 must be negated.2. The x and y variables in the plot of IFT and FT in Figure 1 must be interchanged to correspond to Equations 1 and 2.
3. With the interchanged variables in Figure 1, the plot represents the correct IFT but not the incorrect IFT in Equation 2. These are minor points, but they increased my opportunity cost in reading the article.
Thank you again for the complimentary copy, but with regrets
I don't think I will subscribe.
Grace O. Donn
Escondido, CA
Thank you for your comments. Unfortunately, to answer your questions, we would need to show pages and pages of research. If you are interested in more details, you might consult some of John Ehlers' other published works.-Editor
SUBSCRIBERS' AREA
Editor,
I was wondering whether a subscriber (such as me) can view the webpage where you post the Excel code that accompanies some articles? Do you put the actual article there too that talks about the code?
Anyway, thank you. I like using Excel for implementing technical
analysis techniques. I'd rather not buy another expensive piece of software
and have to learn that, then keep it updated, especially when Excel is
so powerful and is a very useful tool for many other applications as well.
Gordon Tatro, via email
Visit the Subscribers' Area of our website at https://technical.traders.com/sub/sublogin.asp. Login requires your last name and subscriber number.
At our Subscribers' Area, you will find code that appeared in our articles, and, if the author was able to provide it, a downloadable Excel spreadsheet file. However, you will only find the code itself here; the entire article and its graphics are not reproduced there.
Thank you for your feedback. We can appreciate your comments about spreadsheets being a good all-around tool and one that is accessible to most readers. That's why we've encouraged the inclusion of spreadsheet code in our articles over the years, since we can't offer code for every different program that readers use.-Editor
LOWS & HIGHS
Editor,
I enjoyed your January 2004 S&C article, "Buying The Lows, Selling
The Highs." I have a few questions: How is the 3/10 oscillator calculated?
What is the percent accuracy? Can it be successfully used on daily charts
as well as hourly?
Robert Stephens, via email
The 3/10 oscillator is a creation of trader Linda Bradford Raschke, and it is discussed in her book, Street Smarts (which was co-authored with Laurence A. Connors). She discusses the oscillator in the context of a setup strategy for swing trading that she refers to as the anti.
I am not aware of any performance statistics using this indicator. Raschke's method calls for buying dips (or selling rallies) when the oscillator, which had been moving with the dip (or bounce), hooks back in the direction of the previous, prevailing trend. I know that users of TradeStation have been able to download the EasyLanguage code for her oscillator from the TradeStation website. Others can duplicate the action of the 3/10 moving average in the same way she did, with a stochastic set to 7%K and a 10%D (she recommends setting any "smoothing" of the %K line at four).
Insofar as Raschke mentions colleagues who use the anti setup on five-minute S&P charts, it sounds as though the indicator would be useful on a variety of time frames.
I hope this helps.-David Penn, Staff Writer
MACD AND WEALTH-LAB
Editor,
I enjoyed David Penn's article in the February 2004 Stocks &
Commodities, "Rising All The Way Down," which describes Alexander Elder's
implementation of the Macd histogram. It enticed me to "write the book."
How would I get information to write a trading script for Wealth-Lab using
the change in direction on a daily Macd as one screen, and as the second,
an overbought/oversold stochastic condition?
Nick D'Andrea, via email
We haven't developed code for this, so try contacting Wealth-Lab at www.Wealth-Lab.com to find out whether they have that code or chartscript available, or perhaps someone reading this will write in with ideas.-Editor
ERRATA
In the April 2004 S&C on page 34 of Martin Pring's article,
"Do Price Patterns Really Work?", we inadvertently reversed the labels
"A" and "B" in Figure 3. We regret this error. The corrected figure is
shown below.-Editor
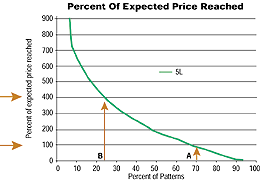
FIGURE 3: PERCENTAGE OF PRICE OBJECTIVE MET. Here you can see what percentage of 1,748 bottom patterns met or exceeded their price objectives, and by how much.
Back to June 2004 Contents