June 2004
TRADERS' TIPS
You can copy these formulas and programs for easy use in your spreadsheet or analysis software. Simply "select" the desired text by highlighting as you would in any word processing program, then use your standard key command for copy or choose "copy" from the browser menu. The copied text can then be "pasted" into any open spreadsheet or other software by selecting an insertion point and executing a paste command. By toggling back and forth between an application window and the open Web page, data can be transferred with ease.
This month's tips include formulas and programs for:
TRADESTATION: VOLUME FLOW INDICATOR
METASTOCK: VOLUME FLOW INDICATOR
AMIBROKER: VOLUME FLOW INDICATOR
eSIGNAL: VOLUME FLOW INDICATOR
WEALTH-LAB: VOLUME FLOW INDICATOR
TRADINGSOLUTIONS: VOLUME FLOW INDICATOR
NEUROSHELL TRADER: VOLUME FLOW INDICATOR
NEOTICKER: VOLUME FLOW INDICATOR
PROPHET.NET: VOLUME FLOW INDICATOR
INVESTOR/RT: VOLUME FLOW INDICATOR
FINANCIAL DATA CALCULATOR: VOLUME FLOW INDICATOR
TRADE NAVIGATOR: VOLUME FLOW INDICATOR
or return to June 2004 Contents
TRADESTATION: VOLUME FLOW INDICATOR
Markos Katsanos' article "Using Money Flow To Stay With The Trend" in this issue describes a method of assessing trend strength with a modified on-balance volume calculation. A function, three indicators, and a strategy are provided here in TradeStation EasyLanguage.
The calculations are done in the function "VfiSmoothed." The function receives some of its arguments by reference. The arguments that are received by reference use "o" as the first character in their names. They are first declared in the indicator, and then received by the function, where they are altered. The function itself returns (by value) the "smoothed VFI" value and (by reference) returns intermediate values for graphic display. The indicator VFI-volume displays the calculated up and down volume, and compares the "curtailed" volume value with the total volume.
The final indicator, VFI-IPO, is described by Katsanos as a tool for IPOs (initial public offerings), which, because they are new equities, have limited historical data available). The strategy code is based on the strategy described by Katsanos in the article. Our chart (Figure 1) mimics Katsanos' Figure 2.
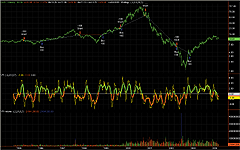
Figure 1: TRADESTATION, VOLUME FLOW INDICATOR. This sample TradeStation chart shows Markos Katsanos' volume flow indicator for initial public offerings (VFI-IPO). Because IPOs are new equities, they have a limited amount of historical data available. This chart mimics Figure 2 in Katsanos' article in this issue.
Function: VFISmooth

inputs:
   Coef( NumericSimple ),
   VCoef( NumericSimple ),
   Period( NumericSimple ),
   SmoothedPeriod( NumericSimple ),
   MyVolume( NumericRef ),
   CutOff( NumericRef ),
   VC( NumericRef ),
   MF( NumericRef ),
   VFI( NumericRef ) ;

variables:
   MyTypicalPrice( 0 ),
   Inter( 0 ),
   VInter( 0 ),
   VAve( 0 ),
   MyVolAvg( 0 ),
   VMax( 0 ),
   DirectionalVolume( 0 ) ;

MyTypicalPrice = TypicalPrice ;
MyVolAvg = Average( MyVolume, Period ) ;
MF = MyTypicalPrice - MyTypicalPrice[1] ;

if MyTypicalPrice > 0 and MyTypicalPrice[1] > 0 then
   begin
   if MyTypicalPrice > 0 and MyTypicalPrice[1] > 0 then
      Inter = Log( MyTypicalPrice ) -
      Log( MyTypicalPrice[1] )
   else
      Inter = 0 ;
      VInter = StdDev( Inter, 30 ) ;
      CutOff = Coef * VInter * Close ;
      VAve = MyVolAvg[1] ;
      VMax = VAve * VCoef ;
      VC = Iff( MyVolume < VMax , MyVolume, VMax ) ;
      DirectionalVolume = Iff( MF > CutOff, VC, Iff( MF < -CutOff, -VC, 0 ) ) ;
      VFI = Summation( DirectionalVolume, Period ) / VAve ;
      VFISmooth = XAverage( VFI, SmoothedPeriod ) ;
   end
else
VFISmooth = 0 ;


Indicator: VFI

inputs:
   Coef( 0.2 ),
   VCoef( 2.5 ),
   Period( 130 ),
   SmoothedPeriod( 3 ) ;

variables:
   oCutOff( 0 ),
   oVC( 0 ),
   oMF( 0 ),
   oVFI( 0 ),
   MyVFI( 0 ),
   MyVolume( 0 ) ;

MyVolume = Iff( BarType < 2, Ticks, Volume ) ;
MyVFI = VFISmooth( Coef, VCoef, Period, SmoothedPeriod,
MyVolume, oCutOff, oVC, oMF, oVFI ) ;

if MyVFI > 0 then
   SetPlotColor( 2, Green )
else
   SetPlotColor( 2, Red ) ;

Plot1( oVFI, "VFI" ) ;
Plot2( MyVFI, "SmoothVFI" ) ;
Plot3( 0, "0" ) ;

Indicator: VFI Volume

inputs:
   Coef( 0.2 ),
   VCoef( 2.5 ),
   Period( 130 ),
   SmoothedPeriod( 3 ) ;

variables:
   oCutOff( 0 ),
   oVC( 0 ),
   oMF( 0 ),
   oVFI( 0 ),
   MyVFI( 0 ),
   MyVolume( 0 ) ;

MyVolume = Iff( BarType < 2, Ticks, Volume ) ;
MyVFI = VFISmooth( Coef, VCoef, Period, SmoothedPeriod,
MyVolume, oCutOff, oVC, oMF, oVFI ) ;

if oMF > oCutOff then
   SetPlotColor( 1, Green )
else if oMF < oCutOff then
   SetPlotColor( 1, Red )
else
   SetPlotColor( 1, DarkGray ) ;

Plot1( oVC, "VFIVol" ) ;
Plot2( MyVolume, "FullVol" ) ;


Indicator: VFI IPO

variables:
MyTypicalPrice( 0 ),
MyVolume( 0 ),
VFIIPO( 0 ) ;

MyTypicalPrice = TypicalPrice ;
MyVolume = Iff( BarType < 2, Ticks, Volume ) ;
VFIIPO = Cum( Iff( MyTypicalPrice > MyTypicalPrice[ 1 ],
   MyVolume, Iff( MyTypicalPrice < MyTypicalPrice[1],
   -MyVolume, 0 ) ) ) ;

Plot1( VFIIPO, "VFI-IPO" ) ;


Strategy: VFI strategy

inputs:
   Coef( 0.2 ),
   VCoef( 2.5 ),
   Period( 130 ),
   SmoothedPeriod( 3 ) ;

variables:
   oCutOff( 0 ),
   oVC( 0 ),
   oMF( 0 ),
   oVFI( 0 ),
   MyVFI( 0 ),
   MyVolume( 0 ) ;

MyVolume = Iff( BarType < 2, Ticks, Volume ) ;
MyVFI = VFISmooth( Coef, VCoef, Period, SmoothedPeriod,
MyVolume, oCutOff, oVC, oMF, oVFI ) ;

if MyVFI crosses over 0 then
   Buy next bar at market ;
if MyVFI crosses under 0 then
   SellShort next bar at market ;
An ELD file including the above EasyLanguage strategy can be found at www.tradestationworld.com. Look for the file "VFI.ELD".
--Mark Mills
MarkM@TSSec at www.TradeStationWorld.com
EasyLanguage Questions Forum
TradeStation Securities, Inc.
A subsidiary of TradeStation Group, Inc.
METASTOCK: VOLUME FLOW INDICATOR
See the sidebar in Markos Katsanos' article in this issue for MetaStock code for implementing the volume flow indicator, which Katsanos provided along with his article.
AMIBROKER: VOLUME FLOW INDICATOR
In "Using Money Flow To Stay With the Trend," Markos Katsanos presents a new kind of volume flow indicator based on the well-known on-balance volume indicator. To recreate the volume flow indicator (VFI) presented in the article in AmiBroker, select Indicator Builder from the Analysis menu, click the "Add" button, enter the formula shown in Listing 1, and then press "Apply." A sample chart is in Figure 2.
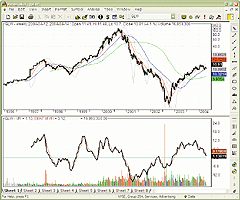
Figure 2: AMIBROKER, VOLUME FLOW INDICATOR. This AmiBroker screenshot shows a weekly price chart of GLW [Corning Inc.] (upper pane) and 26-week VFI indicator with its seven-bar EMA plus color-coded volume bars in the lower pane.
LISTING 1

Period = Param("VFI Period", 26, 26, 1300, 1 );

Coef = 0.2;

VCoef = Param("Max. vol. cutoff", 2.5, 2.5, 50, 1 );

inter = log( Avg ) - log( Ref( Avg, -1 ) );

Vinter = StDev(inter, 30 );

Cutoff = Coef * Vinter * Close;

Vave = Ref( MA( V, Period ), -1 );

Vmax = Vave * Vcoef;

Vc = Min( V, VMax );

MF = Avg - Ref( Avg, -1 );

VCP = IIf( MF > Cutoff, VC, IIf ( MF < -Cutoff, -VC, 0 ) );

VFI = Sum( VCP , Period )/Vave;

VFI = EMA( VFI, 3 );

Plot( VFI, "VFI", colorBlack, styleThick );

Plot( EMA( VFI, 7 ), "EMA7 of VFI", colorBrown );

Plot( 0, "", colorSeaGreen, styleNoLabel );

Plot( V, "Volume", IIf( VCP > 0, colorGreen,

      IIf( VCP < 0, colorRed, colorBlue ) ),

      styleHistogram | styleOwnScale | styleNoLabel );
--Tomasz Janeczko, AmiBroker.com
www.amibroker.com
eSIGNAL: VOLUME FLOW INDICATOR
This eSignal code implements the volume flow indicator (VFI) as described
by Markos Katsanos in this issue.
/*****************************************************************
Provided By : eSignal. (c) Copyright 2004
Study:
Volume Flow Indicator by Markos Katsanos
Version:
1.0
4/8/2004
Formula Parameters:
Default:
MA of VFI Length
50
*****************************************************************/
function preMain() {
setStudyTitle("Volume Flow Indicator ");
setShowTitleParameters(false);
setCursorLabelName("VFI", 0);
setCursorLabelName("VFI MA", 1);
setDefaultBarFgColor(Color.green, 0);
setDefaultBarFgColor(Color.blue, 1);
setDefaultBarThickness(2, 0);
setDefaultBarThickness(1, 1);
addBand(0, PS_SOLID, 1, Color.black, "zero");
var fp1 = new FunctionParameter("nVFImaLen", FunctionParameter.NUMBER);
fp1.setName("MA of VFI Length");
fp1.setLowerLimit(1);
fp1.setDefault(50);
}
var nTyp = null;
// Current typical price
var nTyp1 = null;
// Previous typical price
var nTypChg = 0;
// Current typical price change
var vVol = null;
// Current volume
var nVolSum = 0;
// Cumulative volume sum
var nVolAdj = 0;
// Current adjusted volume
var nVolMA = null;
// Current Vol MA
var nVolMA1 = null;
// Previous Vol MA
var aTypPrice = new Array(30); // Array of changes in typical price
var aVolume = new Array(50); // Volume array
var VFI = null;
// Current VFI
var aVFI = new Array(3);
// Array of VFI values for EMA calc
var aEMA = null;
// Array of VFI 3EMA values
// globals for EMA
var vEMA = null;
var vEMA1 = null;
var dPercent = 0.0;
var bPrimed = false;
var bEdit = false;
function main(nVFImaLen) {
var nState = getBarState();
var vInter = 0;
var nCutoff = 0;
var vMAofEMA = null;
var dSum = 0;
var i = 0;
if (bEdit == false) {
if (aEMA == null) aEMA = new Array(nVFImaLen);
bEdit = true;
}
if (nState == BARSTATE_NEWBAR) {
if (nTyp != null) {
aTypPrice.pop();
aTypPrice.unshift(nTypChg);
nTyp1 = nTyp;
}
if (nVol != null) {
aVolume.pop();
aVolume.unshift(nVol);
}
nVolMA1 = nVolMA;
nVolSum += nVolAdj;
if (VFI != null) {
aVFI.pop();
aVFI.unshift(VFI);
}
if (vEMA != null) {
aEMA.pop();
aEMA.unshift(vEMA);
}
}
nVol = volume();
if (nVol == null) return;
aVolume[0] = nVol;
if (aVolume[49] != null) {
for (i = 0; i < 50; ++i) {
dSum += aVolume[i];
}
nVolMA = dSum/50;
}
nTyp = (high() + low() + close()) / 3;
if (nTyp1 != null) {
nTypChg = (Math.log(nTyp) - Math.log(nTyp1));
aTypPrice[0] = nTypChg;
}
if (nVolMA == null || nVolMA1 == null) return;
if (aTypPrice[29] != null) {
vInter = StDev();
nCutoff = (.2 * vInter * close());
} else {
return;
}
nVolAdj = nVol;
//Minimal Change Cutoff
if ((nTyp - nTyp1) >= 0 && (nTyp - nTyp1) < nCutoff) nVolAdj = 0;
if ((nTyp - nTyp1) < 0 && (nTyp - nTyp1) > -nCutoff) nVolAdj = 0;
// Volume curtailment
if (nVolAdj > (2.5*nVolMA1)) nVolAdj = (2.5*nVolMA1);
if (nTyp - nTyp1 < 0) nVolAdj *= -1;
VFI = ((nVolSum + nVolAdj) / nVolMA1);
aVFI[0] = VFI;
if (vEMA != null) {
if (vEMA >= 0) {
setBarFgColor(Color.green, 0);
} else {
setBarFgColor(Color.red, 0);
}
}
if (aVFI[2] != null) {
vEMA = EMA();
aEMA[0] = vEMA;
}
if (aEMA[nVFImaLen-1] != null) {
dSum = 0;
i = 0;
for(i = 0; i < nVFImaLen; ++i) {
dSum += aEMA[i];
}
vMAofEMA = dSum/nVFImaLen;
}
return new Array(vEMA, vMAofEMA);
}
/***** Functions *****/
function StDev() {
var nLength = 30;
var sumX = 0;
var sumX2 = 0;
for (i = 0; i < nLength; ++i) {
sumX += aTypPrice[i];
sumX2 += (aTypPrice[i] * aTypPrice[i])
}
var meanX = (sumX/nLength);
var stdev = Math.sqrt((sumX2/nLength) - (meanX*meanX));
return stdev;
}
function EMA() {
var nBarState = getBarState();
var dSum = 0.0;
var nLength = 3;
if(nBarState == BARSTATE_ALLBARS || bPrimed == false) {
dPercent = (2.0 / (nLength + 1.0));
bPrimed = false;
}
if (nBarState == BARSTATE_NEWBAR) {
vEMA1 = vEMA;
}
if(bPrimed == false) {
for(i = 0; i < nLength; i++) {
dSum += aVFI[i];
}
bPrimed = true;
return (dSum / nLength);
} else {
return (((VFI - vEMA1) * dPercent) + vEMA1);
}
}
/*****************************************************************
Provided By : eSignal. (c) Copyright 2004
Study:
Volume Curtailment by Markos Katsanos
Version:
1.0
4/8/2004
Formula Parameters:
Default:
N/A
*****************************************************************/
function preMain() {
setStudyTitle("Volume Curtailment ");
setShowTitleParameters(false);
setCursorLabelName("Volume", 0);
setCursorLabelName("Vol Cutoff", 1);
setDefaultBarFgColor(Color.green, 0);
setDefaultBarFgColor(Color.black, 1);
setDefaultBarThickness(3, 0);
setDefaultBarThickness(1, 1);
setPlotType(PLOTTYPE_HISTOGRAM, 0);
}
var nTyp = null;
// Current typical price
var nTyp1 = null;
// Previous typical price
var nTypChg = 0;
// Current typical price change
var vVol = null;
// Current volume
var nVolSum = 0;
// Cumulative volume sum
var nVolAdj = 0;
// Current adjusted volume
var nVolMA = null;
// Current Vol MA
var nVolMA1 = null;
// Previous Vol MA
var aTypPrice = new Array(30); // Array of changes in typical price
var aVolume = new Array(50); // Volume array
function main() {
var nState = getBarState();
var vInter = 0;
var nCutoff = 0;
var dSum = 0;
var i = 0;
var vColor = Color.blue;
if (nState == BARSTATE_NEWBAR) {
if (nTyp != null) {
aTypPrice.pop();
aTypPrice.unshift(nTypChg);
nTyp1 = nTyp;
}
if (nVol != null) {
aVolume.pop();
aVolume.unshift(nVol);
}
nVolMA1 = nVolMA;
nVolSum += nVolAdj;
}
nVol = volume();
if (nVol == null) return;
aVolume[0] = nVol;
if (aVolume[49] != null) {
for (i = 0; i < 50; ++i) {
dSum += aVolume[i];
}
nVolMA = dSum/50;
}
nTyp = (high() + low() + close()) / 3;
if (nTyp1 != null) {
nTypChg = (Math.log(nTyp) - Math.log(nTyp1));
aTypPrice[0] = nTypChg;
}
if (nVolMA == null || nVolMA1 == null) return;
if (aTypPrice[29] != null) {
vInter = StDev();
nCutoff = (.2 * vInter * close());
} else {
return;
}
nVolAdj = nVol;
//Minimal Change Cutoff
if ((nTyp - nTyp1) >= 0 && (nTyp - nTyp1) < nCutoff) nVolAdj = 0;
if ((nTyp - nTyp1) < 0 && (nTyp - nTyp1) > -nCutoff) nVolAdj = 0;
// Volume curtailment
if (nVolAdj > (2.5*nVolMA1)) nVolAdj = (2.5*nVolMA1);
if (nTyp - nTyp1 < 0) nVolAdj *= -1;
if (nVolAdj > 0) vColor = Color.green;
if (nVolAdj < 0) vColor = Color.red;
setBarFgColor(vColor);
return new Array(nVol, (2.5*nVolMA1).toFixed(0)*1);
}
/***** Functions *****/
function StDev() {
var nLength = 30;
var sumX = 0;
var sumX2 = 0;
for (i = 0; i < nLength; ++i) {
sumX += aTypPrice[i];
sumX2 += (aTypPrice[i] * aTypPrice[i])
}
var meanX = (sumX/nLength);
var stdev = Math.sqrt((sumX2/nLength) - (meanX*meanX));
return stdev;
}
A sample chart is in Figure 3.
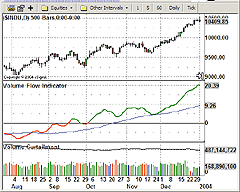
FIGURE 3: eSIGNAL VOLUME FLOW INDICATOR. The VFI line
is colored green when above zero and red when below. The blue line is the
50-period simple moving average of the VFI. The volume curtailment value
was added to this study to make it easy to identify the volume bars that
exceeded that value. The color of the volume bars reflect the rules for
minimal price change cutoff.
Click here to download this code.
--Jason Keck
eSignal, a division of Interactive Data Corp.
800 815-8256, www.esignal.com
WEALTH-LAB: VOLUME FLOW INDICATOR
This VFI demo ChartScript for detecting divergence between the VFI and
price borrows a good deal of code from our December 2003 Traders' Tip on
divergence bias. Since peaks often do not correlate well between VFI and
the underlying price series, we modified the code to first detect the main
price peaks and then perform a proximity search for a peak in VFI. If a
nearby peak was not found, we used the value of VFI on the price series'
peak bar.
Since peaks and troughs require a certain amount of movement in the
reverse direction before they can be detected, we plotted ZZT (see Traders'
Tips, STOCKS & COMMODITIES, November 2003) to provide a visual reference
of when the peaks would have been valid. As you can see in Figure 4, detecting
divergences can prove to provide prescient setups for backtesting and trading.
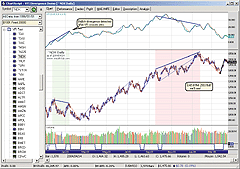
Figure 4: WEALTH-LAB, VOLUME FLOW INDICATOR. The VFI
divergence demo detects peak divergences and automatically draws the divergence
lines and background colors. Wealth-Lab's custom implementation of VFI
includes the volume bar coloring.
We've added the VFI indicator to the code library for retrieval via the
Community|Download ChartScripts feature in Wealth-Lab Developer's main
menu. Visitors to Wealth-lab.com can also run the VFI divergence demo script
from a browser. First choose ChartScripts|Search from main menu, enter
"VFI" in the Title Search, and press the Submit button. Select the VFI
script from the list, enter any US stock symbol, and finally click "Execute
ChartScript."
{ VFI Divergence Demo }
{$I 'ZigZagX Study'}
{$I 'VFI'}
{$I 'ZZT'}
{ Script variables }
var Bar, n, pb1, pb2, vb1, vb2, lastDrawn, xBars,
TestBar, hZZT, ZZTPane, hVFI, VFIPane, Color: integer;
var p1, p2, v1, v2: float;
{ Reversal values to detect peaks/troughs }
const PriceReversal = 6.0;
const VFIReversal = 1.5;
const Proximity = 6;
{ Function to return the sign of a number }
function Sign( x: float ): integer;
begin
if x >= 0 then
Result := 1
else
Result := -1;
end;
hVFI := VFISeries( 130, 3, 0.2, 2.5 );
VFIPane := CreatePane( 100, true, true );
PlotSeriesLabel( hVFI, VFIPane, #Teal, #Thick, 'VFI(130,3,0.2,2.5)' );
hZZT := ZZTSeries( #Close, PriceReversal, false);
ZZTPane := CreatePane( 25, false, true );
PlotSeriesLabel( hZZT, ZZTPane, #Blue, #Thick, 'ZZT' );
{ Plot Zig-Zags on Price and VFI }
ZigZagX( #Close, 0, PriceReversal, false );
try
ZigZagX( hVFI, VFIPane, VFIReversal, true );
except
DrawLabel( 'Volume N/A for this symbol!', VFIPane );
end;
{ Perform Divergence Analysis }
for Bar := 130 to BarCount - 1 do
begin
{ Divergence between Price and VFI - tops }
try
SetPeakTroughMode( #AsPercent );
pb1 := PeakBar( Bar, #Close, PriceReversal );
pb2 := PeakBar( pb1, #Close, PriceReversal );
p1 := Peak( Bar, #Close, PriceReversal );
p2 := Peak( pb1, #Close, PriceReversal );
SetPeakTroughMode( #AsPoint );
TestBar := Round( Min( Bar, pb1 + Proximity ) );
vb1 := PeakBar( TestBar, hVFI, VFIReversal );
{ Test proximity of peaks }
if Abs( pb1 - vb1 ) > Proximity then
vb1 := pb1;
xBars := Round( Min( pb1 - pb2 - 1, Proximity ) );
TestBar := Round( Min( vb1 - 1, pb2 + xBars ) );
vb2 := PeakBar( TestBar, hVFI, VFIReversal );
if Abs( pb2 - vb2 ) > Proximity then
vb2 := pb2;
v1 := @hVFI[vb1];
v2 := @hVFI[vb2];
if Sign( p1 - p2 ) <> Sign( v1 - v2 ) then
begin
if pb1 <> lastDrawn then
begin
lastDrawn := pb1;
DrawLine( pb1, p1 * 1.01, pb2, p2 * 1.01, 0, #Blue, #Thick );
DrawLine( vb1, v1 + 1.0, vb2, v2 + 1.0, VFIPane, #Blue, #Thick );
if Sign( p1 - p2 ) = -1 then
Color := #GreenBkg
else
Color := #RedBkg;
for n := pb2 to pb1 do
SetPaneBackgroundColor( n, 0, Color );
end;
end;
except
end;
end;
-- Robert Sucher, Wealth-Lab, Inc.
www.wealth-lab.com
TRADINGSOLUTIONS: VOLUME FLOW INDICATOR
In "Using Money Flow To Stay With the Trend," Markos Katsanos presents
the volume flow indicator, along with indicators for aiding in displaying
the underlying values.
The calculation of the volume flow indicator (VFI) in TradingSolutions
is as follows:
Name: Volume Flow Indicator
Short Name: VFI
Inputs: Close, High, Low, Volume, Period for VFI, Maximum Volume Cutoff
Formula:
EMA (Div (Sum (If (GT (Abs (Change (Typical (Close,High,Low),1)),
Mult3 (0.2, StDev (Change (Ln (Typical (Close, High, Low)),1),30),
Close)), Mult (Min (Volume, Mult (Lag (MA (Volume, Period for VFI),1),
Maximum Volume Cutoff)), Sign (Change (Typical (Close, High, Low),1))),0),
Period for VFI), Lag (MA (Volume, Period for VFI),1)),3)
The calculation of the VFI for securities with less than one week
of data is as follows:
Name: Volume Flow Indicator (Brief)
Short Name: VFIBrief
Inputs: Close, High, Low, Volume
Formula:
Add (Mult (Volume, Sign (Change (Typical (Close, High, Low),1))), Prev (1))
The calculation of the color-coded volume bars is as shown below.
After adding them to a chart, use "Change Display Properties of Field..."
from the context menu for each field to change the display to bars of the
appropriate color.
Name: Volume Flow Plus (Green)
Short Name: VFIPlus
Inputs: Close, High, Low, Volume, Period for VFI, Maximum Volume Cutoff
Formula:
If (GT (Change (Typical (Close, High, Low),1), Mult3 (0.2,
StDev (Change (Ln (Typical (Close, High, Low)),1),30), Close)),
Min (Volume, Mult (Lag (MA (Volume, Period for VFI),1),
Maximum Volume Cutoff)),0)
Name: Volume Flow Minus (Red)
Short Name: VFIMinus
Inputs: Close, High, Low, Volume, Period for VFI, Maximum Volume Cutoff
Formula:
If (LT (Change (Typical (Close, High, Low),1), Negate (Mult3 (0.2,
StDev (Change (Ln (Typical (Close, High, Low)),1),30), Close))),
Min (Volume, Mult (Lag (MA (Volume, Period for VFI),1),
Maximum Volume Cutoff)),0)
Name: Volume Flow Neutral (Blue)
Short Name: VFINeutral
Inputs: Close, High, Low, Volume, Period for VFI, Maximum Volume Cutoff
Formula:
If (LT (Abs (Change (Typical (Close, High, Low),1)),Mult3 (0.2,
StDev (Change (Ln (Typical (Close, High, Low)),1),30), Close)),
Min (Volume, Mult (Lag (MA (Volume,Period for VFI),1),
Maximum Volume Cutoff)),0)
A sample chart is in Figure 5.
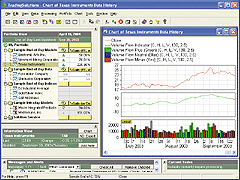
Figure 5: TRADINGSOLUTIONS, VOLUME FLOW INDICATOR. Here's
a sample TradingSolutions chart displaying the volume flow indicator and
the color-coded volume bars.
These functions are available in a function file that can be downloaded
from the TradingSolutions website (www.tradingsolutions.com) in the Solution
Library section.
As with many indicators, indicators like these can make good inputs
to neural network predictions. If used directly, you will want to set the
preprocessing to "None," since the value can be positive or negative.
--Gary Geniesse
NeuroDimension, Inc.
800 634-3327, 352 377-5144
https://www.tradingsolutions.com
GO BACK
NEUROSHELL TRADER: VOLUME FLOW INDICATOR
The volume flow indicator described by Markos Katsanos in this issue
can be easily implemented in NeuroShell Trader by combining a few of NeuroShell
Trader's 800 indicators plus two custom indicators. To implement the volume
flow indicator, select "New Indicator ..." from the Insert menu and use the
Indicator Wizard to create the following indicators:
TYPICAL:
Avg3 ( High, Low, Close)
CUTOFF:
Multiply3 ( 0.2, StndDev ( Momentum (Ln (TYPICAL),1), 30 ), Close )
VAVE:
LagAvg ( Volume, 1, 130 )
VC:
Min2 ( Volume, Multiply2 ( 2.5, VAVE ) )
MF :
Momentum (TYPICAL, 1 )
VFI:
Divide (Sum(IfThenIfThenElse (A>B(MF,CUTOFF), VC, A<B(MF, Negative(CUTOFF)), Negative(VC), 0), 130), VAVE)
Users of NeuroShell Trader can go to the STOCKS & COMMODITIES
section of the NeuroShell Trader free technical support website to download
a sample chart that includes the volume flow indicator (Figure 6).
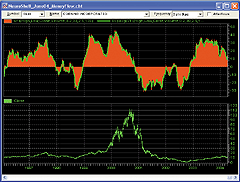
Figure 6: NEUROSHELL TRADER, VOLUME FLOW INDICATOR. Here's
a sample chart in NeuroShell Trader displaying the volume flow indicator.
--Marge Sherald, Ward Systems Group, Inc.
301 662-7950, sales@wardsystems.com
www.neuroshell.com
NEOTICKER: VOLUME FLOW INDICATOR
NeoTicker formula language can easily implement the two indicators presented
in the article "Using Money Flow To Stay With The Trend" by Markos Katsanos
in this issue.
To recreate the VFI indicator in NeoTicker, first create a new formula
indicator; name it "VFI" with the description "volume flow indicator."
The VFI indicator has four parameters, which are:
Period for Vfi: integer, default 130;
Coefficient: real, default 0.2;
Max volume cutoff: real, default 2.5;
Signal line period: integer, default 3.
This indicator has two plots: the first plot is the VFI with a red
line as the default plot style; the second plot is an exponential moving
average signal line with a green dashed line as the default plot style.
After setup is completed, input the indicator code (Listing 1) into
the script editor. Choose Indicator>Install to install the indicator (Figure
7).
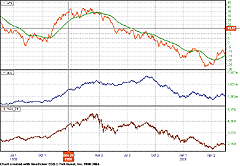
Figure 7: NEOTICKER, VOLUME FLOW INDICATOR. The volume
flow indicator has two plots: the first plot is the indicator with a red
line as the default plot style, while the second plot is an exponential
moving average signal line with a green dashed line as the default plot
style.
Volume color code
NeoTicker requires only one indicator instead of three to plot the
three-color volume histogram. This is because NeoTicker's special plot
style HLColor can change the color of each bar according to calculation
results.
First, create a new formula indicator with the name "volcolor" and volume
color code as the description. The volcolor indicator has five parameters,
which are:
Coefficient: real, default 0.2;
Max volume cutoff: real, default 2.5;
Up volume color: color, default lime;
Down volume color: color, default red;
Neutral volume color: color, default blue.
(Note: Color is a special parameter type in NeoTicker, Setting parameter type to "color" allows users to directly select color visually.)
The plot style HLColor has three plots, where the first and second
plots are the high and low of a vertical bar, and the third plot allows
the indicator to programmatically change the color of the vertical lines.
In the case of the volume color coding, the first plot is set to the value
of volume after curtailment, the second plot is set to zero to create a
histogram effect, and the third plot, which is the color specification,
is set according to cutoff conditions.
Next, enter the formula indicator code shown in Listing 2. Install the
indicator, and the volume color code indicator is ready for use in NeoTicker
(Figure 8).
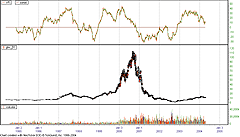
Figure 8: NEOTICKER, VOLUME COLOR CODING. The plot style
HLColor has three plots, where the first and second plots are the high
and low of a vertical bar, and the third allows the indicator to programmatically
change the color of the vertical lines. In the case of the volume color
coding, the first plot is set to the value of volume after curtailment,
the second plot is set to zero to create a histogram effect, and the third
plot, which is the color specification, is set according to cutoff conditions.
VFI trading system
NeoTicker BackTest EZ is a tool that allows users to quickly test their
trading ideas with simple formula conditions.
Use the following two formulas to emulate the crossover zero idea presented
in Katsanos' article:
Long Entry: xaboveconst(0,VFI(0,data1,130,0.2,2.5,3),0)
Short Entry: xbelowconst(0,VFI(0,data1,130,0.2,2.5,3),0)
The result from Backtest EZ is the equity curve that resulted from
trading signals generated by the long entry and short entry formulas.
Listing 1
myPeriod := if(param1 > 1300, 1300, if(param1 < 5, 5, param1));
myCoef := param2;
myVCoef := if(param3 > 50, 50, if(param3 < 0, 0, param3));
myTypical := (h+l+c)/3;
Inter := ln(myTypical) - ln(myTypical(1));
Vinter := stddev(Inter, 30);
Cutoff := myCoef*Vinter*c;
Vave := mov(1,data1.V,"Simple",myPeriod);
Vmax := Vave*myVCoef;
VC := if(v < Vmax, V, Vmax);
MF := myTypical-myTypical(1);
plot1 := summation(if(MF > Cutoff, VC,
if(MF < -1*Cutoff, -1*VC, 0)), myPeriod)/Vave;
plot2 := qc_xaverage(0,plot1,param4);
Listing 2
Coef := param1;
VCoef := if(param2 < 0, 0, if(param2 > 50, 50, param2));
Typical := (h+l+c)/3;
Inter := ln(Typical)-ln(Typical(1));
Vinter := Stddev(Inter, 30);
Cutoff := Coef*Vinter*c;
Vave := qc_xaverage(1, data1.v, 50);
Vmax := Vave*Vcoef;
VC := if(v < Vmax, V, Vmax);
MF := Typical - Typical(1);
plot1 := VC;
plot2 := 0;
Plot3 := if(MF > Cutoff, param3, if(MF < -1*Cutoff, param4, param5));
A downloadable version of these indicators will be available from
the Yahoo! NeoTicker user group file area at https://groups.yahoo.com/group/neoticker/.
--Kenneth Yuen, TickQuest Inc.
www.tickquest.com
PROPHET.NET: VOLUME FLOW INDICATOR
The volume flow indicator, which is presented by Markos Katsanos in
his article in this issue, is available on the Prophet.Net website (https://www.Prophet.net)
to all premium members. No coding is required on the part of the user.
The indicator is built into the JavaCharts applet.
The volume flow indicator, described as a substantial improvement over
the 40-year-old on-balance volume indicator, can be displayed beneath a
chart and can also be superimposed on other indicators. For one-click access
to this indicator, go to JavaCharts from your computer's browser:
Prophet.Net : Analyze : JavaCharts
https://www.prophet.net/analyze/javacharts.jsp
Or click the Analyze tab on the Prophet.net website, then click
the JavaCharts selection.
Click on the Tools menu (which you can also access by right-clicking
anywhere on a chart) and choose Apply Studies from the Studies menu item.
The list of available studies (approximately 150 of them, shown in alphabetical
order) is in the second dropdown menu; you can choose "volume flow indicator
balance" from this list. You may also adjust the parameters for this study
if you desire.
In JavaCharts, you can also apply indicators to other indicators (instead
of applying it to the price). For example, Katsanos' article describes
the value of applying a moving average to the volume flow indicator. You
can do this in JavaCharts by choosing the simple moving average, changing
the bar period to the amount desired (such as "50" for a 50-day moving
average), and then applying the indicator to the volume flow indicator,
as show in Figure 9.
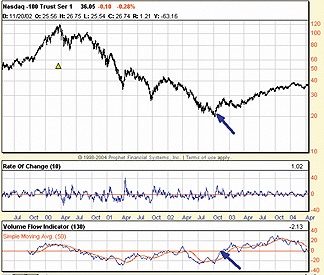
Figure 9: PROPHET.NET, VOLUME FLOW INDICATOR. In this
chart of QQQ, the arrow indicates when the volume flow indicator shifted
from negative to positive (bearish to bullish). This almost exactly marked
the turning point in the index back in October 2002, when a bottom was
made after the extended collapse from March 2000.
In Figure 9, which is a chart of QQQ, the arrow indicates when the
volume flow indicator shifted from negative to positive (bearish to bullish).
This almost exactly marked the turning point in the index back in October
2002, when a bottom was made after the extended collapse from March 2000.
The Vfi stayed in this bullish level until very recently, when it seems
to have made its way back into the bearish zone.
--Prophet.net
https://www.prophet.net/tasc
INVESTOR/RT: VOLUME FLOW INDICATOR
The volume flow indicator (VFI) discussed in Katsanos' article can be
implemented in Investor/RT using a custom indicator. A chart showing this
VFI custom indicator can be seen in Figure 10.
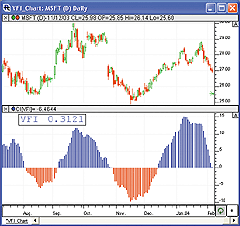
Figure 10: INVESTOR R/T. This Investor/RT daily chart
shows Microsoft (MSFT) plotted in candlestick style. In the lower pane,
the custom indicator representing the volume flow indicator (VFI) is shown
drawn in histogram style.
The VFI custom indicator has the following syntax:
EMA(SUM(CI_V, 30) / AVG(SMIN(VO, 2.5 * VMA.1), 30))
where VMA represents the 30-period moving average of volume, VO represents
the current volume, EMA is a three-period exponential smoothing, and CI_V
is in turn another custom indicator with the syntax:
(((MID - MID.1) > CI_Cutoff) - ((MID.1 - MID) > CI_Cutoff)) * SMIN(VO, 2.5 * VMA.1)
where Mid is the typical price (HLC/3), and CI_Cutoff is again another custom indicator with the syntax:
0.2 * CL * STAT(LOG(MID) - LOG(MID.1))
where Stat is the statistic indicator set up as the 30-period standard
deviation, and Log is the natural logarithm.
The chart seen in Figure 11 along with the VFI custom indicator described
above, can be easily imported into Investor/RT by visiting the Investor/RT
Shared Charts web page at https://www.linnsoft.com/charts/.
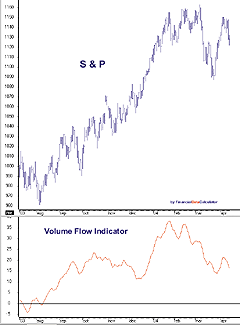
Figure 11: FINANCIAL DATA CALCULATOR, VOLUME FLOW INDICATOR.
Here's
a sample chart displaying the volume flow indicator in FDC.
You can access additional information on the Investor/RT features
of custom indicators, Vma, Stat, and Rtl Tokens by visiting the following
pages:
https://www.linnsoft.com/tour/customIndicator.htm
https://www.linnsoft.com/tour/techind/volume.htm
https://www.linnsoft.com/tour/techind/stat.htm
https://www.linnsoft.com/tour/rtlTokens.htm
--Chad Payne, Linn Software
800-546-6842, info@linnsoft.com
www.linnsoft.com
FINANCIAL DATA CALCULATOR: VOLUME FLOW INDICATOR
Financial Data Calculator can easily reproduce the volume flow indicator
(VFI) described by Markos Katsanos in this issue. As there is a possibility
that the trader will want to see the VFI of multiple stocks or futures,
it would be most useful to create a macro, which we have illustrated here.
To produce the VFI, open the Macro Wizard, choose "New macro," and enter
the following code:
@ VFI syntax = VFI dataset
vinter: 30 movstdv change ln typical #R
Cutoff: .2 * vinter
Vave: (130 movave vol #R) back 1
Vmax: 2.5 * Vave
Vval: (vol #R) min vmax
PosV: Vval*((change typical #R) gt cutoff)
NegV: -Vval*((change typical #R) lt cutoff)
RawVFI: (130 movsum (posv + negv))/Vave
3 expave RawVFI
Save this macro under the name "vfi." You can then apply it to any target
dataset. For example, if you entered the line vfi msft in the FDC command
window, the output would be the VFI for the dataset "msft."
The VFI definition above normalizes the indicator over the preceding
six months of volume data. Those wishing to apply VFI to datasets with
a short history should normalize over the last month (21 trading days)
and use the following code to define "vfishort." The 21-day smoothing is
particularly appropriate, because option expiry tends to influence a strong
monthly cyclicality in volume.
@VFIshort syntax = VFISHORT dataset
vinter: 21 movstdv change ln typical #R
Cutoff: .2 * vinter
Vave: (21 movave vol #R) back 1
Vmax: 2.5 * Vave
Vval: (vol #R) min vmax
PosV: Vval*((change typical #R) gt cutoff)
NegV: -Vval*((change typical #R) lt cutoff)
RawVFI: (21 movsum (posv + negv))/Vave
3 expave RawVFI
--William Rafter, Financial Data Calculator
856 857- 9088
www.financialdatacalculator.com
GO BACK
TRADE NAVIGATOR: VOLUME FLOW INDICATOR
Markos Katsanos' article "Using Money Flow To Stay With The Trend" shows
us how to improve on Joseph Granville's on-balance volume (OBV) indicator
by using price and volume thresholds (COEF and VMAX).
Here, we have provided the TradeSense code for nine functions, all of
which are available upon request. The formulas provided are intended for
use within the Trade Navigator Gold and Platinum versions, but can also
be provided via special file for Trade Navigator Silver.
To enter each of these functions into your Trade Navigator, first pull
up your Traders Toolbox. Continue to the Functions tab of your Toolbox,
and click on "New." You will now have a "New Function" window, where you
will enter the formula for the Coef function.
Once you finish typing in the formula, click on Save and name it appropriately.
To create the next function, go back to the Toolbox by clicking the Toolbox
button (see Figure 12), and click the "New" button on the Functions tab.
Each of these functions, once created, can be added to the charts by clicking
the letter "A" on the keyboard, selecting the Indicators tab and then double-clicking
on the name of the desired indicator.
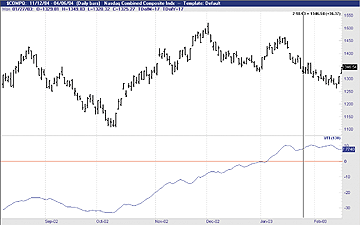
Figure 12: GENESIS TRADE NAVIGATOR, VOLUME FLOW INDEX (VFI).
This
sample Trade Navigator chart shows the VFI indicator on the Nasdaq Composite
Index ($COMPQ) daily chart.
Note: Each indicator has inputs that may need to be defined on the
Inputs tab of the Function editor (please see "Default Values For Inputs"
under each formula seen below).
COEF
Formula:
2 * (.1)
Default Values for Inputs:
None
INTER
Formula:
Log (Typical Price) - Log (Typical Price.1)
Default Values for Inputs:
None
VINTER
Formula:
Std Devs As Value (INTER , 30 , 1)
Default Values for Inputs:
None
CUTOFF
Formula:
COEF * VINTER * Close
Default Values for Inputs:
None
MF
Formula:
Typical Price - Typical Price.1
Default Values for Inputs:
None
VAVE
Formula:
MovingAvg (Volume , period).1
Default Values for Inputs:
Period = 130
VMAX
Formula:
VAVE (PERIOD) * 2.5
Default Values for Inputs:
Period = 130
VC
Formula:
IFF (Volume < VMAX (PERIOD) , Volume , VMAX (PERIOD))
Default Values for Inputs:
Period = 130
VFI
Formula:
MovingAvgX (MovingSum(IFF(MF>CUTOFF,VC(PERIOD)+0,IFF(MF<CUTOFF*(-1),0-VC(PERIOD),0)),PERIOD)/VAVE(PERIOD),3)
Default Values for Inputs:
Period = 130
For more information on Trade Navigator, visit www.GenesisFT.com.
--Chad Noble
Genesis Financial Technologies, Inc.
719 884-0245, Support@GFDS.com
All rights reserved. © Copyright 2004, Technical Analysis,
Inc.
Return to June 2004 Contents