Better Than The OBV?
Volume Flow Indicator Performance
by Markos Katsanos
Find out how well the volume flow indicator performs in this, the second of a two-part series on the VFI.
Last month, I introduced a long-term money flow indicator I call the volume flow indicator (VFI). The VFI is based on the on-balance volume (OBV), but with three important modifications:
- Positive readings indicate a bullish state and negative readings a bearish state.
- The calculation is based on the day's median instead of the closing price.
- A threshold was introduced to take into account minimal price changes and another threshold to eliminate excessive volume.
To assess the efficacy of the new indicator and whether the modifications added any value, I tested VFI against OBV, the buy and hold method, and a price-based indicator. In order to evaluate the new indicator's properties, I conducted tests using divergence, direction, and indicator level signals separately. The same tests were repeated substituting VFI with OBV and a price-based indicator.
To eliminate any stock-specific bias, I used four different stocks. The second test is of special interest as I used a new method for calculating divergence, which produced better than anticipated results.
TESTING METHODS
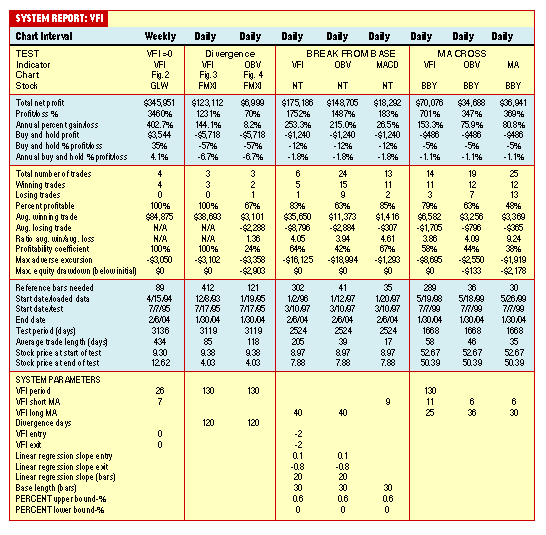
The most useful test statistics are presented in Figure 1. I used MetaStock Professional 8.0 for the tests, and only long sales were tested. All tests started with an initial equity of $10,000. In order to compare with the buy and hold method, I compounded profits or losses and closed positions on the last bar. All orders were executed at next day's opening price at the market, and the commission charged was $10. Interest was credited at an average rate of 3% when out of the market.

FIGURE 1: VFI vs. OBV. The VFI outperformed OBV on all tests. The first three tests produced only a few trades and are hence more appropriate for long-term investors. Test 1 managed to avoid the recent bear market and is therefore a very attractive alternative for the buy and hold investor. Test 4 produced more frequent trades, but at the expense of poorer performance compared with the rest.
If you wish to replicate the tests, please keep in mind that for the test to begin calculating VFI and its moving average, twice the number of VFI period bars must be loaded before any trade can be produced: once for the volume moving average and once for the VFI summation. So for a 130-day VFI with a 40-day moving average, you will need to load (130*2)+40 = 300 days of extra data before the test can start producing trading signals.
...Continued in the July issue of Technical Analysis of STOCKS & COMMODITIES
Excerpted from an article originally published in the July 2004 issue of Technical Analysis of STOCKS & COMMODITIES magazine. All rights reserved. © Copyright 2004, Technical Analysis, Inc.
Return to July 2004 Contents