A Tutorial On Bands
Creating Your Own Trading System
by René Koch, Ph.D.
It can be done -- and without the headache you would expect.
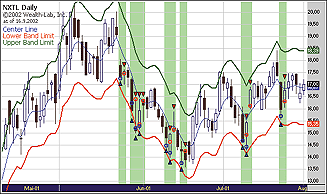
In technical analysis, when you hear the word band it consists of two boundaries: one above and one below the price series similar to what you see in Figure 1. In that, the daily price chart for Nextel (NXTL), the thick red line is the lower boundary of a "constant" band. Whenever prices go below the red line, a buy signal (blue circle) is generated. One or two bars later, the position is closed (red circle). The green background identifies the profitable trades.

FIGURE 1: CENTER LINE. Here's a simple example of a center line based on a six-period EMA of average price.
Usually, prices move within a certain range. If something unexpected happens, prices rise above or fall below their usual range due to panic (or enthusiasm). After some time has elapsed, the event is forgotten and prices return to their usual level. You'll find this phenomenon based on mass psychology to be applicable in any market that is influenced by human participants.
CONSTRUCTING BANDS
To construct a band, you need two variables: a center and a distance.
The center line: This is shown in Figure 1 as a blue line. The line should follow the center of the price series. The most obvious basis for a center line is the average price of a bar, calculated by:
Usually, the line that connects these average price points is volatile (that is, the line changes too fast, which results in poor performance of the respective trading system). That is why the average price sequence is smoothed by some moving average.(High - Low) / 2
There are several options when it comes to calculating an ideal center line. They could be based on the following principles:
Average price: Avg = (High + Low) / 2
Average of high, low, and close: AvgC = (High + Low + Close) / 3
A weighted mean of open, high, low, and close:
  AvgP = (w1 * Open + w2 * High + w3 * Low + w4 * close) / (w1 + w2 + w3 + w4)
These averages are usually very noisy, so it is a good idea to smooth them using a smoothing function. To do that, you can use one of the following:
- SMA(N): The linear average of N periods or length
- EMA(N): The exponential average of a time constant, N
- WMA(N): The weighted moving average of N periods or length
- ASEMA(Nup, Ndown): An asymmetrical exponential moving average that moves faster in one direction than the other
...Continued in the July issue of Technical Analysis of STOCKS & COMMODITIES
Excerpted from an article originally published in the July 2004 issue of Technical Analysis of STOCKS & COMMODITIES magazine. All rights reserved. © Copyright 2004, Technical Analysis, Inc.
Return to July 2004 Contents