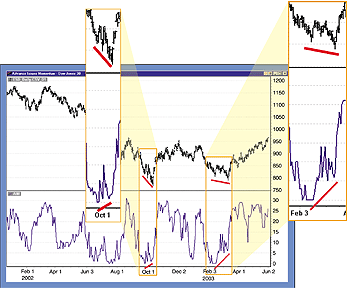
Advance Issues Momentum
Boosting Profitability
by Lawrence Chan and Louis Lin
Here's how you can use advance issues momentum to create an end-of-day trading system with superior profitability.
The stock exchanges broadcast the number of advancing issues each trading day. This advancing issues data has proven useful for analyzing market breadth. In fact, for many traders it is an essential indicator for everyday trading because it represents the sentiment of the entire market. For our purposes here, I will refer to the advancing issues data as broad market advancing issues, since it represents the advancing issues of all stocks traded.
Although advancing issues data is a useful indicator, it does have one deficiency. Since it includes all the traded issues, there may be several not included in the index or industrial group. Thus, advancing issues of the broader markets may not be focused well as an indicator. In addition, broader-market advancing issues are not range-bound; there are no limits to how high or low they can go. This makes the interpretation of advancing issues subjective, which could be a slight disadvantage for systematic traders. The problem is more severe for end-of-day (EOD) systems, since the total symbols and composition of the broad market change.
In this article, I will present a new type of collection method for advancing issues. This generates a new class of indicator called advance issues momentum (AIM). AIM is designed to avoid the deficiencies of the broad market advancing issues by combining the n-days momentum from a fixed-symbol basket.
PICKING A SYMBOL BASKET
The basket of symbols you select depends on the instrument to be traded. The basket should be a good representation of the market to which the instrument belongs. In this article, I will use the components of the Dow Jones Industrial Average (DJIA) as the basket. With 30 components, the basket size meets the minimal requirement for sound statistical data collection.

Figure 1: AIM with 20-day momentum. Note that extreme readings approximately coincide with turning points.
...Continued in the August issue of Technical Analysis
of STOCKS & COMMODITIES.
Excerpted from an article originally published in the August 2004 issue of Technical Analysis of STOCKS & COMMODITIES magazine. All rights reserved. © Copyright 2004, Technical Analysis, Inc.
Return to August 2004 Contents