Point, Figure, And Trade
Predicting Turning Points With Cobweb Theory
by Chris Satchwell, Ph.D.
Economics plays a role in the markets. Here's how the underlying premise of point & figure theory is consistent with the tenets of cobweb theory.
The methods used in technical analysis fall into two broad types. The first, which includes most technical indicators, treats price as a noise-corrupted signal, and seeks to find a true signal that can be used to infer price's direction. The second type encompasses ideas on support, resistance, and trading patterns. These concepts describe the existence of barriers to price movements where turning points occur, and try to infer price movement from one or more of those turning points.
I am interested in both; I am neutral as to which of them might work best. For example, an article I wrote on regularization, published in the July 2003 STOCKS & COMMODITIES, was on the methods of the first type. S&C Contributing Editor John Ehlers subsequently showed how a regularization parameter could be chosen to make this accessible method perform as effectively as a two-pole Butterworth filter.
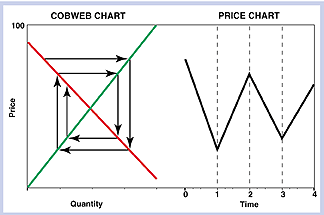
This article is about the second approach to technical analysis, and how it ties in with a well-known hypothesis of economics known as cobweb theory. Economists like their supply and demand curves; they have trouble accepting technical analysis because so many of its signals are based on price alone. However, cobweb theory, which is familiar to economists, provides a basis for predicting the next turning point in a sequence without knowledge of the supply and demand curves, or the quantities of whatever is being bought and sold. I will demonstrate that the underlying premise of point & figure theory is consistent with the tenets of cobweb theory, and thus attempt to make this second approach to technical analysis more acceptable to at least some of its critics.
PRICE/TIME PRADIGMS
To avoid confusion about when cobweb theory is applicable, note that many price/time paradigms describe market behavior, and cobweb theory is only one of them. Economist K.E. Wärneryd described three primary psychological drivers behind price movements: a) price changes of the recent past, b) historical price levels, and c) the effect of news. Each of these effects has predominated in various historical situations.
For example, in the 1920s boom, price rises of the recent past were used to "prove" that historical levels were irrelevant, which led to a mistaken belief that poverty had been beaten. In the spring of 1940, the DJIA had been flat for a while, but in May, an unexpected German conquest of continental western Europe triggered a rapid fall of around 30%.
In contrast, in December 1941, the DJIA was in a bear market (making it less inclined to search for a new direction), and the Japanese attack on Pearl Harbor barely registered as a blip in that bear market. Price/time paradigms a) and c) are situations in which cobweb theory is not generally applicable, but paradigm b), where historical price levels predominate, is where cobweb theory tends to be most useful.

Figure 1: Linear price/quantity relationship. The absolute value of the supply curve (green line) gradient is greater than that of the demand curve (red line). The result is a dampened fluctuation in price (purple line).
Excerpted from an article originally published in the August 2004 issue of Technical Analysis of STOCKS & COMMODITIES magazine. All rights reserved. © Copyright 2004, Technical Analysis, Inc.