August 2004
TRADERS' TIPS
You can copy these formulas and programs for easy use in your spreadsheet or analysis software. Simply "select" the desired text by highlighting as you would in any word processing program, then use your standard key command for copy or choose "copy" from the browser menu. The copied text can then be "pasted" into any open spreadsheet or other software by selecting an insertion point and executing a paste command. By toggling back and forth between an application window and the open Web page, data can be transferred with ease.
This month's tips include formulas and programs for:
NEOTICKER: Advance Issues Momentum (AIM)
METASTOCK: Advance Issues Momentum (AIM)
TRADESTATION: Advance Issues Momentum (AIM)
AMIBROKER: Advance Issues Momentum (AIM)
eSIGNAL: Advance Issues Momentum (AIM)
NEUROSHELL TRADER: Aadvance Issues Momentum (AIM)
ASPEN GRAPHICS: Advance Issues Momentum (AIM)
TECHNIFILTER PLUS: Advance Issues Momentum (AIM)
FINANCIAL DATA CALCULATOR: Advance Issues Momentum (AIM)
AIQ: Advance Issues Momentum (AIM)
SMARTRADER: Advance Issues Momentum (AIM)
WEALTH-LAB: Advance Issues Momentum (AIM)
INVESTOR/RT: Advance Issues Momentum (AIM)
NEOTICKER: Advance Issues Momentum (AIM)
Editor's note: Lawrence Chan and Louis Lin of TickQuest (developer of NeoTicker) contributed the article to this issue on which this month's Traders' Tips is based ("Boosting Profitability"), and they have included NeoTicker code in the article. Thus, please see the article starting on page 28 in this issue for NeoTicker code for the advance issues momentum (AIM) indicator.
--Kenneth Yuen, TickQuest Inc.GO BACK
www.tickquest.com
METASTOCK: Advance Issues Momentum (AIM)
Lawrence Chan and Louis Lin's article in this issue, "Boosting Profitability," includes the NeoTicker code for their AIM indicator. The MetaStock code is listed below. This formula uses the Security Data function, which is only available in MetaStock version 8.01 or later or any version of MetaStock Professional.
To enter this indicator into MetaStock:
1. In the Tools menu, select Indicator Builder.
2. Click New to open the Indicator Editor for a new indicator.
3. Type the name of the formula.
4. Click in the larger window and type in the formula.
Name: AIM
Formula:
x:=Input("Momentum Periods",1,200,10);
(Security("ONLINE:AA", Mo(x)>0))+
(Security("ONLINE:AXP", Mo(x)>0))+
(Security("ONLINE:BA", Mo(x)>0))+
(Security("ONLINE:C", Mo(x)>0))+
(Security("ONLINE:CAT", Mo(x)>0))+
(Security("ONLINE:DD", Mo(x)>0))+
(Security("ONLINE:DIS", Mo(x)>0))+
(Security("ONLINE:EK", Mo(x)>0))+
(Security("ONLINE:GE", Mo(x)>0))+
(Security("ONLINE:GM", Mo(x)>0))+
(Security("ONLINE:HD", Mo(x)>0))+
(Security("ONLINE:HON", Mo(x)>0))+
(Security("ONLINE:HPQ", Mo(x)>0))+
(Security("ONLINE:IBM", Mo(x)>0))+
(Security("ONLINE:INTC", Mo(x)>0))+
(Security("ONLINE:IP", Mo(x)>0))+
(Security("ONLINE:JNJ", Mo(x)>0))+
(Security("ONLINE:JPM", Mo(x)>0))+
(Security("ONLINE:KO", Mo(x)>0))+
(Security("ONLINE:MCD", Mo(x)>0))+
(Security("ONLINE:MMM", Mo(x)>0))+
(Security("ONLINE:MO", Mo(x)>0))+
(Security("ONLINE:MRK", Mo(x)>0))+
(Security("ONLINE:MSFT", Mo(x)>0))+
(Security("ONLINE:PG", Mo(x)>0))+
(Security("ONLINE:SBC", Mo(x)>0))+
(Security("ONLINE:T", Mo(x)>0))+
(Security("ONLINE:UTX", Mo(x)>0))+
(Security("ONLINE:WMT", Mo(x)>0))+
(Security("ONLINE:XOM", Mo(x)>0))
The formula is written to use online data. It can be modified to
use data stored locally by replacing the text "ONLINE:" with the path to
the local data. For example, if the local data was stored in the folder
C:\ MetaStock Data \ Dow 30, the second line of the formula would look
like this:
(Security("C:\ MetaStock Data \ Dow 30\AA", Mo(x)>0))+
The same change would be made to all the other lines that start
with the word "Security." Please note that the path entered must be correct
or the formula will return errors. In addition, since custom indicators
are limited to 2,500 characters, there is a limit to the number of securities
this indicator can reference. This limit will vary based on the length
of the path specified for the security's datafiles. Using a short path
or online data will allow for more securities to be used.
The system test presented in the article can be recreated using the
following MetaStock formulas:
Buy Order:
pi:= Fml( "AIM");
Ref(Sum(pi<Ref(pi,-1),2)=2,-1) AND
(pi>Ref(pi,-1)) AND
((pi-Ref(pi,-1))<5) AND
(pi<20)
Sell Order:
pi:= Fml( "AIM");
Ref(Sum(pi>Ref(pi,-1),2)=2,-1) AND
(pi<Ref(pi,-1)) AND
((Ref(pi,-1)-pi)<5) AND
(pi<20)
--William GolsonGO BACK
Equis International
www.MetaStock.com
TRADESTATION: Advance Issues Momentum (AIM)
Lawrence Chan and Louis Lin's article, "Advance Issues Momentum: Boosting Profitability," outlines a method of calculating the 20-day momentum for a "basket" of stocks. In the article, the basket of stocks consists of the 30 stocks in the Dow Jones Industrial Average (DJIA). The process of computing the basket's AIM (advance issues momentum indicator) begins with the creation of a multiple security chart (TradeStation allows up to 50 securities to be inserted into a single chart). In the article's example, the traded security was not a member of the basket of securities used to create the basket composite index (the traded security was not one of the 30 DJIA components), so 31 securities (the 30 Dow components and the traded security) must be inserted into the chart.
The function "CompositeMomentum" in TradeStation calculates the AIM value. This function has three parameters. The first parameter determines the starting datastream for calculation of the basket composite index. In the example, the basket index components are in datastreams data2 through data31, so the first parameter passed to the CompositeMomentum function is the number 2 (indicating that the first datastream to be used in calculation of the basket index is data2). The second parameter is the number 30, the number of components in the basket. The third parameter is the number 20, the momentum length as described in the article.
For charting purposes, the function is used as the input named "Formula" to the built-in study named "Custom 3 Lines." Thus, the built-in TradeStation indicator "Custom 3 Lines" is inserted into the chart and formatted so that its "Formula" input is set to CompositeMomentum( 2, 30, 20).
We will also provide a TradeStation strategy using the AIM (code follows).
It is based on the trading rules outlined in Chan and Lin's article.
Function: CompositeMomentum
An .eld file including this EasyLanguage code will be posted in the file library at www.tradestationworld.com. Look for the file "Boosting Profitability.eld." A sample chart can be seen in Figure 1.inputs: StartStream( NumericSimple ), Components( NumericSimple ), Length( NumericSimple ) ; variables: CMTotal( 0 ), CMComponent( 0 ), StreamNumber( 0 ) ; CMTotal = 0 ; if BarType < 2 then RaiseRunTimeError( "Function requires daily or weekly bars." ) ; for StreamNumber = StartStream to ( StartStream + Components - 1 ) begin if Close Data( StreamNumber ) > Close[Length] Data( StreamNumber ) then CMComponent = 1 else CMComponent = 0 ; CMTotal = CMTotal + CMComponent ; end ; CompositeMomentum = CMTotal ; Strategy: CompositeMomentumSt inputs: StartStream( 2 ), Components( 30 ), MomentumLength( 20 ), BuyThreshold( 20 ), ShortThreshold( 10 ); variables: CompMom( 0 ); CompMom = CompositeMomentum( StartStream, Components, MomentumLength ) ; if CompMom[3] > CompMom[2] and CompMom[2] > CompMom[1] and CompMom[1] < CompMom and CompMom - CompMom[1] < 5 and CompMom < BuyThreshold then Buy next bar at market ; if CompMom[3] < CompMom[2] and CompMom[2] < CompMom[1] and CompMom[1] > CompMom and CompMom - CompMom[1] > 5 and CompMom > ShortThreshold then SellShort next bar at market ;

FIGURE 1:TRADESTATION, AIM. This sample TradeStation chart shows a trading strategy with buy and sell signals using the AIM indicator, based on the trading rules outlined in Lawrence Chan and Louis Lin's article in this issue.
--Mark MillsGO BACK
MarkM@TSSec at www.TradeStationWorld.com
EasyLanguage Questions Forum
TradeStation Securities, Inc.
A subsidiary of TradeStation Group, Inc.
AMIBROKER: Advance Issues Momentum (AIM)
In "Boosting Profitability," Lawrence Chan and Louis Lin present the advance issues momentum (AIM) indicator and show how it can be used as a base for development of an end-of-day trading system for the S&P emini.
AIM is a composite (breadth) indicator that can be coded using AmiBroker's AFL function called AddToComposite. The AddToComposite function allows the user to easily build composites/breadth indicators of any kind. AmiBroker's online formula library at https://www.amibroker.com/library/list.php features many unique composite indicators that can be used to create profitable trading systems.
Listing 1 shows the code that builds the composite AIM, plots it (Figure 2), and implements a simple trading system that follows the one presented in the article. The formula should be applied in both the Automatic Analysis window (for backtesting) and Indicator Builder window (for plotting).

FIGURE 2: AMIBROKER, ADVANCE ISSUES MOMENTUM (AIM) INDICATOR. This AmiBroker screenshot shows a daily chart of an S&P 500 emini contract (upper pane) and AIM with 20-day momentum (lower pane). The highlighted divergence marks the beginning of an uptrend.
To build the AIM in AmiBroker, click the "Filter" button in the
Automatic Analysis window, pick the watchlist consisting of the Dow Jones
30 components, then click OK and click "Scan."
In one second, the composite ticker "~Aim" will hold the values of our advance issues momentum indicator generated for the Dow 30 stocks. If you applied the code from Listing 1 to Indicator Builder as well, you will also see the chart of AIM plotted in the lower pane of the window. After that, select the S&P emini symbol, then in the Automatic Analysis window, choose "Apply to: Current" and click "Back test" to perform a system test.
In a short while, the backtest will be complete, and you can then choose
the "Show arrows for actual trades" menu to show the buy/sell arrows and
get detailed statistics, including the well-known Sharpe ratio, ulcer index,
and many others by clicking on the "Report" button.
GO BACKLISTING 1 // Scan formula that builds ~AIM composite // run over DJ 30 UpMomentum = Close > Ref( Close, -20 ); AddToComposite( UpMomentum, "~AIM", "X" ); // build ~AIM composite // Back test code - run over single symbol - ES (e-mini SP500) for example AIM = Foreign("~AIM", "X" ); SetTradeDelays( 1, 1, 1, 1 ); Buy = Ref( AIM, -3 ) > Ref( AIM, -2 ) AND Ref( AIM, -2 ) > Ref( AIM, -1 ) AND AIM - Ref( AIM, -1 ) < 5 AND AIM < 20; Sell = Ref( AIM, -3 ) < Ref( AIM, -2 ) AND Ref( AIM, -2 ) < Ref( AIM, -1 ) AND Ref( AIM, -1 ) - AIM < 5 AND AIM > 10; Short = Sell; Cover = Buy; // for trading single contract only // values for ES PositionSize=MarginDeposit=4000; // initial margin PointValue=50; // dollar value of 100 points // Plot code Plot( AIM, "AIM", colorRed );
--Tomasz Janeczko, AmiBroker.com
www.amibroker.com
eSIGNAL: ADVANCE ISSUES MOMENTUM (AIM)
This eSignal code recreates the AIM indicator described by Lawrence Chan and Louis Lin in their article, "Boosting Profitability."
Note that eSignal advanced charts has a symbol limit of seven. Thus, the maximum limit for the basket of symbols to include in the advance issues momentum study is 7. The default basket of symbols is currently set to $Bank (Nasdaq Banking), $Nbi (Nasdaq Biotech), $Ixco (Nasdaq Computer), $Ixf (Nasdaq Financial), and $Ixtc (Nasdaq Telecommunications).

FIGURE 3: eSIGNAL, ADVANCE ISSUES MOMENTUM. Here is a demonstration of the AIM indicator on an eSignal chart.
Due to the restricted number of symbols, a small modification was
also made to the trading signals that requires the AIM number to be less
than or equal to half of the total number of symbols to enter a long position.
The article uses a ratio equal to two thirds, which was a bit too restrictive
for a smaller number of symbols.
This study is compatible with the Strategy Analyzer for backtesting as well as real-time usage.
To discuss this study further or to download the formula, please visit
the EFS Library--Discussion Board forum at www.esignalcentral.com.
/*****************************************************************
Provided By : eSignal. (c) Copyright 2004
Study:        Advance Issues Momentum by Lawrence Chan and Louis Lin
Version:      1.0
6/7/2004
Notes:
Due to the EFS symbol limit of 7, this study was modified to use the
following index symbols as the default.  Up to 7 symbols may be entered
through Edit Studies.
Formula Parameters:                 Default:
Momentum Length                     20
Symbol 1                            $BANK   - Nasdaq Banking
Symbol 2                            $NBI    - Nasdaq Biotech
Symbol 3                            $IXCO   - Nasdaq Computer
Symbol 4                            $IXF    - Nasdaq Financial
Symbol 5                            $IXTC   - Nasdaq Telecommunications
Symbol 6                            NA
Symbol 7                            NA
*****************************************************************/
function preMain() {
    setStudyTitle("Advance Issues Momentum ");
    setShowTitleParameters(false);
    setCursorLabelName("AIM", 0);
    setDefaultBarFgColor(Color.black, 0);
    setDefaultBarThickness(2, 0);

    var fp0 = new FunctionParameter("nMomLen", FunctionParameter.NUMBER);
    fp0.setName("Momentum Length");
    fp0.setLowerLimit(1);
    fp0.setDefault(20);

    var fp1 = new FunctionParameter("sSym1", FunctionParameter.STRING);
    fp1.setName("Symbol 1");
    fp1.setDefault("$BANK");
    var fp2 = new FunctionParameter("sSym2", FunctionParameter.STRING);
    fp2.setName("Symbol 2");
    fp2.setDefault("$NBI");
    var fp3 = new FunctionParameter("sSym3", FunctionParameter.STRING);
    fp3.setName("Symbol 3");
    fp3.setDefault("$IXCO");
    var fp4 = new FunctionParameter("sSym4", FunctionParameter.STRING);
    fp4.setName("Symbol 4");
    fp4.setDefault("$IXF");
    var fp5 = new FunctionParameter("sSym5", FunctionParameter.STRING);
    fp5.setName("Symbol 5");
    fp5.setDefault("$IXTC");
    var fp6 = new FunctionParameter("sSym6", FunctionParameter.STRING);
    fp6.setName("Symbol 6");
    fp6.setDefault("");
    var fp7 = new FunctionParameter("sSym7", FunctionParameter.STRING);
    fp7.setName("Symbol 7");
    fp7.setDefault("");
}
var bEdit = true;
var aSym = new Array(8);
var aPrice0 = new Array(8);
var aPriceN = new Array(8);
var aAIM = new Array(4);
var vAIM = 0;
var nCount = 0;
var vColor = null;
function main(nMomLen, sSym1, sSym2, sSym3, sSym4, sSym5, sSym6, sSym7) {
    var nState = getBarState();
    var nIndex = getCurrentBarIndex();
    var i;

    if (bEdit == true) {
        aSym[0] = getSymbol();
        for (i = 1; i < 8; ++i) {
            aSym[i] = eval("sSym"+i);
            if (aSym[i] != null && aSym[i] != "") nCount++
        }
        setStudyMax(nCount +1);
        setStudyMin(-1);
        bEdit = false;
    }

    if (nState == BARSTATE_NEWBAR) {
        aAIM.pop();
        aAIM.unshift(vAIM);
        for (i = 1; i < 8; ++i) {
            if (aSym[i] != null && aSym[i] != "") {
                aPriceN[i] = close(-nMomLen, aSym[i]);
            }
        }
    }

    for (i = 1; i < 8; ++i) {
        if (aSym[i] != null && aSym[i] != "") {
            aPrice0[i] = close(0, aSym[i]);
        }
    }

    // n-days momentum
    vAIM = 0;
    for (i = 1; i < 8; ++i) {
        if (aPriceN[i] != null && aPrice0[i] != null) {
            if ( (aPrice0[i] - aPriceN[i]) > 0 ) vAIM++;
        }
    }
    aAIM[0] = vAIM;

    // Back Testing code
    var bBT = false;
    var bLong = false;
    var bShort = false;
    if (nIndex < 0 && aAIM[3] != null) { // allow back testing
        bBT = true;
    }
    // Trading Signals
    if (aAIM[3] != null) {
        if (aAIM[3] >= aAIM[2] && aAIM[2] >= aAIM[1] && aAIM[1] < aAIM[0]) {
            if (aAIM[0] <= (0.5 * nCount) ) {
                bLong = true;
                vColor = Color.green;
            }
        } else if (aAIM[3] <= aAIM[2] && aAIM[2] <= aAIM[1] && aAIM[1] > aAIM[0]) {
            if (aAIM[0] >= (0.5 * nCount) ) {
                bShort = true;
                vColor = Color.red;
            }
        }
    }

    // Back Testing Code
    if (bBT == true) {
        if (Strategy.isLong() == false && bLong == true) { // long entry
            Strategy.doLong("Buy", Strategy.MARKET, Strategy.NEXTBAR);
        } else if (Strategy.isShort() == false && bShort == true) { // short entry
            Strategy.doShort("Short", Strategy.MARKET, Strategy.NEXTBAR);
        }
    }

    if (vColor != null) setBarBgColor(vColor);
    return vAIM;
}
--Jason KeckGO BACK
eSignal, a division of Interactive Data Corp.
800 815-8256, www.esignalcentral.com
NEUROSHELL TRADER: Advance Issues Momentum (AIM)
The advance issues momentum (AIM) described by Lawrence Chan and Louis Lin in their article in this issue can be implemented in NeuroShell Trader by combining a few of NeuroShell Trader's 800+ indicators.
To recreate AIM, select "New Indicator ..." from the Insert menu and use the Indicator Wizard to set up the following indicator:
Number Positive Momentum ( TICKERCLOSES, 1, 20 )
Note that the TICKERCLOSES represents the closing prices of all the ticker symbols you choose to include in your AIM indicator. Utilizing multiple selection of other instrument data, you can create a number positive momentum indicator for each of the stocks in your ticker basket with one use of the Indicator Wizard. To do so, simply select the Time Series parameter on the last page of the Indicator Wizard, select "Set Parameter," select "Other Instrument Data ...", and then select as many ticker symbols as you want inside the Other Instrument Data wizard.
After adding the number positive momentum indicators to the chart, create the AIM indicator by using the Add Indicator to sum up the individual number positive momentum indicators.
To recreate the AIM trading system in NeuroShell Trader, select "New
Trading Strategy ..." from the Insert menu and enter the following long and
short entry conditions in the appropriate locations of the Trading Strategy
Wizard:
Users of NeuroShell Trader can go to the STOCKS & COMMODITIES section of the NeuroShell Trader free technical support website to download a sample chart that includes an AIM indicator and AIM trading system (Figure 4).Generate a buy long MARKET order if ALL of the following are true: A<B ( AIM, 20 ) A=B( NumNegMom(AIM,3,1), 2 ) A>B ( Momentum(AIM,1), 0 ) Generate a sell short MARKET order if ALL of the following are true: A>B ( AIM, 10 ) A=B( NumPosMom(AIM,3,1), 2 ) A<B ( Momentum(AIM,1), 0 )

FIGURE 4: NEUROSHELL TRADER, AIM. Here's a sample chart in NeuroShell Trader displaying the advance issues momentum indicator.
--Marge Sherald, Ward Systems Group, Inc.GO BACK
301 662-7950, sales@wardsystems.com
www.neuroshell.com
ASPEN GRAPHICS: ADVANCE ISSUES MOMENTUM (AIM)
Here is the Aspen Graphics formula that reproduces the AIM indicator. To use the formula, include the stocks you wish to use with this study enclosed in parentheses (see example at the top of Figure 5).

FIGURE 5: ASPEN GRAPHICS, AIM. Here's a sample chart displaying the advance issues momentum indicator.
AIMStudy={
 retval = 0
 Momtotal = 0
 for i = 1  to PARAMCOUNT {
  if $[i].last != NONUM then  {
   Momtotal = Momtotal +  mom($[i],20)
  }
 }
 retval =  Divide(MomTotal,PARAMCOUNT)
 retval
}
This formula is written to be used with the Aspen Graphics 4.0 software
so that it can take advantage of the ParamCount parameter. The ParamCount
is used here to count the number of stocks being used with the study so
that I could add up the momentum value of each stock and then divide the
returned value by the value stored in the ParamCount. In the sample chart
in Figure 5, ParamCount will equal 5. A 20-period momentum average was
used to produce the line shown in Figure 5.
--Andy SewellGO BACK
Aspen Research Group
support@aspenres.com
www.aspenresearch.com
TECHNIFILTER PLUS: ADVANCE ISSUES MOMENTUM (AIM)
Here are the TechniFilter Plus formulas discussed in "Boosting Profitability" by Lawrence Chan and Louis Lin in this issue. The TechniFilter Plus variation of the Filter Report, Make History Automation, and Strategy Test discussed in the article are shown here. (See Figures 6 and 7.)

FIGURE 6: TECHNIFILTER PLUS, AIM INDICATOR. This chart shows the S&P 500 index in the upper pane and the advance issues momentum index (AIM) on the lower section of the chart.
FIGURE 7: TECHNIFILTER PLUS, AIM TRADING SYSTEM. Here's a sample chart with buy and sell arrows based on the AIM strategy test.
We use a basic TechniFilter Filter Report profile and the Make History
module to generate an AIM ASCII historical database of the advancing stocks
in our selected list of stocks, for example, the Dow Jones Industrial 30
stocks. The resulting historical ASCII AIM file can be used on charts or
in a strategy backtest.
The AIM historical ASCII file can be generated on any list of stocks,
and hundreds of stocks can be included in the file.
AIM Filter Report
NAME: aim
UNITS TO READ: 30,
FORMULAS
  [1] Symbol
  [2] Aim
(C-cy20)u2  {Momentum Formula Comparing the close to the close 20 days ago.}
                                            {U2 returns only positive or advancing issues}
Here's how to automate the creation/updating of the AIM ASCII historical
database.
Make History Automation
...MAKE HISTORY...
    aim on Dow.lst with 900 units (cutoff:none) and yymmdd dates reset
          any existing files on summary items only +sum
NAME: AIM
TEST TYPE: percentage
DATE RANGE: 01/01/98,30/05/03
POSITION LIMIT: none
ENTRY FEE: 0
EXIT FEE: 0
INITIAL AMOUNT: 50000
INTEREST RATE: 4%
FORMULAS
  [1] Date
  [2] Aim
       ~<aim>~
  [3] LongSig
       ([2]>[2]Y1 & [2]Y1<[2]Y2 & [2]y2<[2]Y3) & [2]<20 & (([2]-[2]Y1)<5)
  [4] ShortSig
       ([2]<[2]Y1 & [2]Y1>[2]Y2 & [2]y2>[2]Y3) & [2]>10 & (([2]Y1-[2])<5)
RULES
  r1: Long
       reverse short to long all on Close
       at signal: LongSig     [3] = 1
  r2: Short
       reverse long to short all on Close
       at signal: ShortSig     [4]=1
Visit TechniFilter Plus at https://www.technifilter.com to download
these formulas and program updates.
--Benzie PikoosGO BACK
Brightspark, +61 8 9375-1178
sales@technifilter.com
www.technifilter.com
FINANCIAL DATA CALCULATOR: ADVANCE ISSUES MOMENTUM (AIM)
To perform the operations described in "Boosting Profitability" in Financial Data Calculator (FDC), one must first produce a list of the Dow Jones 30 stocks. To do that, the FDC user can simply copy the list from Yahoo! Finance or another site. We did that and named our list "dow30," and then using the Data Wizard retrieved the price history of those stocks.
The next step is to compute and save the dataset (we called it "dowaim")
that keeps track of the number of Dow stocks showing a positive 20-day
momentum. The commands for that are as follows:
dowaim gets 0
:for #1 :in dow30
   dowaim gets dowaim + (20 change close #1) > 0
:endfor
Simply enter them in the command window, and press the "Play" button.
To simulate trading, go to the Trade Wizard and list the following buy
and sell conditions:
Buy Entry: - Next Day's Open
 (downrun dowaim back 1) > 2
 ((change dowaim) > 0) and ((change dowaim) < 5)
 dowaim < 20
Sell Entry: - Next Day's Open
 (uprun dowaim back 1) > 2
 ((change dowaim) < 0) and ((change dowaim) > -5)
 dowaim > 10
FDC's Trade Wizard will then ask you for a name, which we assigned
as "aim_dow."
With your trading system ("aim_dow") defined, all that is left is to
apply the trading system to the item to be traded. To trade the S&P
index, enter
"aim_dow snp"
This indicator has many similarities to Tom Dorsey's NYSE buying
pressure index.
--Robert C. Busby, 856 857-9088GO BACK
Mathematical Investment Decisions Inc.
(formerly Futures Software Associates)
www.mathinvestdecisions.com
AIQ: ADVANCE ISSUES MOMENTUM (AIM)
This AIQ Traders' Tip is based on "Boosting Profitability" by
Lawrence Chan and Louis Lin in this issue.
!  ADVANCING ISSUES MOMENTUM
!  "Boosting Profitability" by Lawrence Chan and Louis Lin
!  Coded by Rich Denning 6/10/04
M is 20.
AI is iff([close] - val([close],M) > 0,1,0).
Stk1 is TickerUDF("AA",AI).
Stk2 is TickerUDF("AXP",AI).
Stk3 is TickerUDF("BA",AI).
Stk4 is TickerUDF("C",AI).
Stk5 is TickerUDF("CAT",AI).
Stk6 is TickerUDF("DD",AI).
Stk7 is TickerUDF("DIS",AI).
Stk8 is TickerUDF("EK",AI).
Stk9 is TickerUDF("GE",AI).
Stk10 is TickerUDF("GM",AI).
Stk11 is TickerUDF("HD",AI).
Stk12 is TickerUDF("HON",AI).
Stk13 is TickerUDF("HPQ",AI).
Stk14 is TickerUDF("IBM",AI).
Stk15 is TickerUDF("INTC",AI).
Stk16 is TickerUDF("IP",AI).
Stk17 is TickerUDF("JNJ",AI).
Stk18 is TickerUDF("JPM",AI).
Stk19 is TickerUDF("KO",AI).
Stk20 is TickerUDF("MCD",AI).
Stk21 is TickerUDF("MMM",AI).
Stk22 is TickerUDF("MO",AI).
Stk23 is TickerUDF("MRK",AI).
Stk24 is TickerUDF("MSFT",AI).
Stk25 is TickerUDF("PG",AI).
Stk26 is TickerUDF("SBC",AI).
Stk27 is TickerUDF("T",AI).
Stk28 is TickerUDF("UTX",AI).
Stk29 is TickerUDF("WMT",AI).
Stk30 is TickerUDF("XOM",AI).
AIM is Stk1 + Stk2 + Stk3 + Stk4 + Stk5 + Stk6 +Stk7 + Stk8 + Stk9 + Stk10 +
           Stk11 + Stk12 + Stk13 + Stk14 + Stk15 + Stk16 +Stk17 + Stk18 + Stk19 + Stk20 +
           Stk21 + Stk22 + Stk23 + Stk24 + Stk25 + Stk26 +Stk27 + Stk28 + Stk29 + Stk30.
!Plot "AIM" as a custom indicator against the ES1600 or SPX.
BuySignal if valresult(AIM,3) > valresult(AIM,2)
 and valresult(AIM,2) > valresult(AIM,1)
 and valresult(AIM,1) < AIM
 and AIM - valresult(AIM,1) < 5
 and AIM < 20.
SellSignal if valresult(AIM,3) < valresult(AIM,2)
 and valresult(AIM,2) < valresult(AIM,1)
 and valresult(AIM,1) > AIM
 and valresult(AIM,1) - AIM < 5
 and AIM > 10.
List if 1.
GO BACK
SMARTRADER: ADVANCE ISSUES MOMENTUM (AIM)
Creating the AIM indicator as described by Lawrence Chan and Louis Lin in "Boosting Profitability" is straightforward and uncomplicated in SmarTrader.
First, all 30 of the stocks comprising the Dow Jones Industrial Average are loaded into the SmarTrader spreadsheet. They occupy the first 240 rows and are not shown here.
Next, beginning in row 241 of the SmarTrader specsheet (Figure 8), labeled F1, a user formula to calculate the 20-day momentum and express it as a "conditional" statement was written for the first stock. If the momentum result is positive (true), a "1" will be returned, indicating a price advance. If the condition is not positive (false), a "0" is returned. This formula is repeated for the remaining 29 stocks in the spreadsheet as F2 through F30.

FIGURE 8: SMARTRADER, ADVANCE ISSUES MOMENTUM. Here's the SmarTrader specsheet for implementing Chan and Lin's AIM indicator.
The next three rows are user formulas to total up the number of
advances per day, in groups of 10 for convenience. Then, row 274, labeled
AIM, adds it all together to develop the AIM indicator value for each day
loaded into the spreadsheet.
In the data window alongside the chart pictured in Figure 9, a "1" indicates an advance. A "0" indicates unchanged or a decline. Notice that the AIM value is 27, indicating that on June 6, 2004, 27 of the 30 DJIA stocks were advancing.

FIGURE 9: SMARTRADER, ADVANCE ISSUES MOMENTUM. This SmarTrader chart displays the AIM indicator.As Chan and Lin mention in their article, extreme values of AIM seem to closely coincide with turning points in the price chart.
--Jim Ritter, Stratagem SoftwareGO BACK
504 885-7353, Stratagem1@aol.com
WEALTH-LAB: ADVANCE ISSUES MOMENTUM (AIM)
To calculate the 20-bar advance issues momentum (AIM) indicator described in "Boosting Profitability" by Lawrence Chan and Louis Lin in this issue, we used the Index-Lab add-in program for Wealth-Lab Developer. Index-Lab allows you to create your own market indexes and aggregate indicators by defining the rules in a special IndexScript, an example of which can be seen in Figure 10.
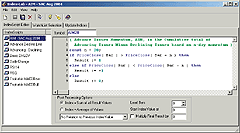
FIGURE 10: WEALTH-LAB, INDEX-LAB. You can easily create and update market indexes and aggregate indicators using Index-Lab, an add-in for Wealth-Lab.
Note that Index-Lab has several post-processing options that calculate
the contribution of each symbol in the WatchList to the overall index or
aggregate indicator. With the IndexScript in place, we need only to assign
it to the WatchList(s) -- which is accessed directly from Wealth-Lab -- and
perform the Update action to calculate the index/indicator, as demonstrated
in Figure 11.
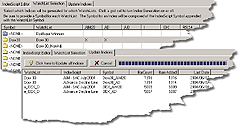
FIGURE 11: WEALTH-LAB, CALCULATING THE INDICATOR. After writing an IndexScript, simply select the WatchList to use in the index calculation(s) by clicking on it. You can update all of your indices with one click for ready access in your ChartScripts.
At this point, you can refer to your newly created (or recently
updated) index just like any other symbol, but without the need to actually
recalculate it each time you run a $imulation.
Download a 30-day free trial of Index-Lab to run this month's AIM ChartScript. A sample chart is in Figure 12.
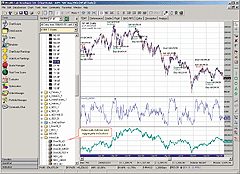
FIGURE 12: WEALTH-LAB, AIM. Here's the AIM indicator plotted in Wealth-Lab. Index-Lab indexes and aggregate indicators automatically appear in their own WatchList so that you can treat them as you would any other symbol.
WealthScript Code:
var Bar, p, hAIM, AIMPane, EqSer, EqPane: integer;
var bLongSAR, Buy, Sell: boolean;
{ Read in the already-calculated AIM series }
hAIM := GetExternalSeries( 'Dow30_AIM20', #Close );
{ Create a series to plot equity in a Chart pane }
EqSer := CreateSeries;
for Bar := 3 to BarCount - 1 do
begin
  Buy := ( @hAIM[Bar] > @hAIM[Bar-1] ) and
         ( @hAIM[Bar-1] < @hAIM[Bar-2] ) and
         ( @hAIM[Bar-2] < @hAIM[Bar-3] ) and
         ( @hAIM[Bar] < 20 ) and
         ( @hAIM[Bar] - @hAIM[Bar-1] < 5 );

  Sell := ( @hAIM[Bar] < @hAIM[Bar-1] ) and
          ( @hAIM[Bar-1] > @hAIM[Bar-2] ) and
          ( @hAIM[Bar-2] > @hAIM[Bar-3] ) and
          ( @hAIM[Bar] > 10 ) and
          ( @hAIM[Bar-1] - @hAIM[Bar] < 5 );
{ Exit Rules }
  if LastPositionActive then
  begin
    p := LastPosition;
    bLongSAR := PositionLong( p );
    if bLongSAR then
    begin
      if Sell then
        SellAtMarket( Bar + 1, p, '' );
    end
    else if Buy then
      CoverAtMarket( Bar + 1, p, '' );
  end;
{ Entry Rules }
  if not bLongSAR then
  begin
    if Buy then
      BuyAtMarket( Bar + 1, '' );
  end
  else if Sell then
    ShortAtMarket( Bar + 1, '' );
  @EqSer[Bar] := Equity( Bar );
end;
AIMPane := CreatePane( 100, false, true );
EqPane  := CreatePane( 100, false, true );
PlotSeriesLabel( EqSer, EqPane, #Black, #Thick, 'Equity' );
PlotSeriesLabel( hAIM, AIMPane, #Blue, #Thick, 'Dow30_AIM20' );
HideVolume;
--Robert SucherGO BACK
www.wealth-lab.com
INVESTOR/RT: ADVANCE ISSUES MOMENTUM (AIM)
The advance issues momentum (AIM) indicator can be easily implemented in Investor/RT with the help of the QuotePage Statistics (QSTAT) indicator found in Investor/RT. QSTAT, among other things, allows the user to take any group of symbols (quotepage) and count the number of symbols for which any given signal is true on each bar. The sample chart seen in Figure 13 shows the 20-period AIM for the DJIA in the lower pane.
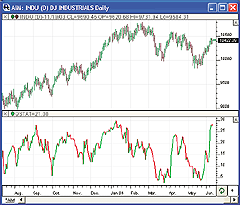
FIGURE 13: INVESTOR/RT, AIM. This Investor/RT daily chart shows the Dow Jones Industrials plotted in bar style in the upper pane. The lower pane shows the 20-period AIM using the 30 components of the DJIA. Each point on the line represents the number of symbols that closed higher than they did 20 bars/days ago.In order to implement a 20-period AIM on the DJIA, first create a quotepage containing the 30 components of the DJIA, and save this quotepage with a name like "Dow 30." You can do this quickly by importing the ticker symbols (File: Import: Ticker Symbols) from the "Dow 30 Stocks.txt" file located in the Investor/RT "Symbols" folder. Next, create a signal (Setup: Signal) with the following syntax:
CL > CL.20
and save this signal with a name like "Advanced." This signal finds
symbols that closed higher than they did 20 bars/days ago.
Next, add the QuotePage Statistic Indicator to a daily chart, using the preferences shown in Figure 14.
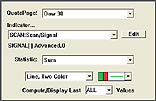
FIGURE 14: INVESTOR/RT, QUOTEPAGE STATISTICS INDICATOR (QSTAT) Preferences. QSTAT provides the user with a variety of statistical results for any combination of indicator and quotepage. In this example, we are summing up the number of symbols that signal "true" on each bar. The signal involved (CL > CL.20) reflects whether each symbol closed higher than it did 20 bars ago.
Each point on the resulting QSTAT line reflects how many symbols
closed higher on that day than they did 20 days ago. The line is painted
red during periods of decreasing AIM, and green during periods of increasing
AIM.
You can access additional information on the Investor/RT QuotePage Statistic
Indicator (QSTAT) by visiting the following page:
https://www.linnsoft.com/tour/techind/qstat.htm
--Chad Payne, Linn Software
info@linnsoft.com, www.linnsoft.com
All rights reserved. © Copyright 2004, Technical Analysis, Inc.
Return to August 2004 Contents
