September 2004
TRADERS' TIPS
You can copy these formulas and programs for easy use in your spreadsheet or analysis software. Simply "select" the desired text by highlighting as you would in any word processing program, then use your standard key command for copy or choose "copy" from the browser menu. The copied text can then be "pasted" into any open spreadsheet or other software by selecting an insertion point and executing a paste command. By toggling back and forth between an application window and the open Web page, data can be transferred with ease.
This month's tips include formulas and programs for:
TRADESTATION: DECOMPOSITON METHOD
WEALTH-LAB: DECOMPOSITION METHOD
AMIBROKER: DECOMPOSITION METHOD
eSIGNAL: DECOMPOSITION METHOD
PROPHET.NET: DECOMPOSITION METHOD
AIQ: DECOMPOSITION METHOD
NEUROSHELL TRADER: DECOMPOSITION METHOD
ASPEN GRAPHICS: DECOMPOSITION METHOD
TRADINGSOLUTIONS: DECOMPOSITION METHOD
TECHNIFILTER PLUS: DECOMPOSITION METHOD
NEOTICKER: DECOMPOSITION METHOD
SMARTRADER: DECOMPOSITION METHOD
FINANCIAL DATA CALCULATOR: DECOMPOSITION METHOD
BULLCHARTS: DECOMPOSITION METHOD
or return to September 2004 Contents
![]() TRADESTATION: DECOMPOSITON METHOD
TRADESTATION: DECOMPOSITON METHOD
Giorgos Siligardos' article in this issue, "The Decomposition Method," presents a procedure for using his reverse-engineered RSI of weekly lows to identify possible price supports. In the article, Siligardos uses a manual charting method to identify significant RSI support levels. These hand-identified levels are then "reverse-engineered" for display on a price chart.
The following EasyLanguage provides an example of how code could be written to automate Siligardos' process. It displays the results in RadarScreen (which is available as part of the TradeStation platform).
Figure 1 shows a RadarScreen containing the 30 Dow Jones industrial stocks. The indicator RevEngRsi2 has been applied to the RadarScreen. This indicator uses a simplistic algorithm for determining RSI support levels that Siligardos might have visually chosen. The top three possible support levels are displayed in RadarScreen. If the most recently completed bar of a given security in the RadarScreen has a low within 3% of the calculated support level, the RadarScreen cell is colored for easy identification. The list of stocks is sorted so those that are currently nearest support levels are at the top.
Using TradeStation's ability to link a selected cell and a chart, TradeStation can provide a visual display of a 15-day history of the mechanically identified price supports for any symbol that is selected in the RadarScreen. To complete the example, the RSI and RSI support levels are displayed in the subgraph in the bottom pane of Figure 1.

Figure 1: TradeStation, Decomposition Method. This sample RadarScreen shows the RevEngRSI2 indicator applied to the 30 Dow Jones industrial stocks. The top three possible support levels are displayed. The Rsi and Rsi support levels are displayed in the subgraph in the bottom pane.
An .eld file including this EasyLanguage code will be posted in
the file library at TradeStationWorld.com. Look for the file "Decomposition.Eld."
Function:  RevEngRSI
inputs:
 Price( NumericSeries ),
 RSIValue( NumericSimple ),
 WilderTimePeriod( NumericSimple ) ;
variables:
 ExpPer( 2 * WilderTimePeriod  - 1 ),
 AUC( 0 ),
 ADC( 0 ),
 X( 0 ) ;
AUC = XAverage( IFF( Price > Price[1], Price - Price[1],
 0 ), ExpPer ) ;
ADC = XAverage( IFF( Price[1] > Price, Price[1] - Price,
 0 ), ExpPer ) ;
X = ( WilderTimePeriod - 1 ) * ( ADC * RSIValue /
 ( 100 - RSIValue ) - AUC ) ;
RevEngRSI = IFF( X >= 0, Price + X, Price + X * ( 100 -
 RSIValue ) / RSIValue ) ;
Indicator: RevEngRSI2
inputs:
 Price( Low ),
 Length( 14 ) ;
variables:
 MyRSI( 0 ),
 TestFlag( true ),
 Support1( 0 ),
 Support2( 0 ),
 Support3( 0 ),
 Support4( 0 ),
  Ans( false ),
 ProximityPct( 0 ),
 Support1Pct( 0 ),
 Support2Pct( 0 ),
 Support3Pct( 0 ) ;
arrays:
 RSICross[50]( 0 ),
 RevEngRSIArray[49]( 0 ) ;
{ Check to see if display is RadarScreen or a Chart
"Ans" is "true" if on a RadarScreen }
if BarNumber = 1 then
    begin
    Value1 = Text_New( Date, Time, 0, "Dummy" ) ;
 if Value1 < 0 then
        Ans = true ;
    end
else
{ delete the object if created }
    begin
    if Value1 > 0 then
        begin
        Text_delete( Value1 ) ;
        Value1 = 0 ;
        end ;
    end ;
MyRSI = RSI( Price, Length ) ;
{ Once RSI values have lost starting point dependence,
start counting RSI crossing of various static (flat)
levels:  2, 4, 6,..., 98 }
if CurrentBar > 4 * Length then
 begin
 for Value1 = 1 to 49
  begin
  if ( MyRSI > Value1 * 2 and MyRSI[1] < Value1 *
   2 ) or ( MyRSI < Value1 * 2 and MyRSI[1] >
   Value1 * 2 ) then
   RSICross[Value1] = RSICross[Value1] + 1 ;
  end ;
 end ;
{ Calculate Reverse-Engineered RSI value for static
(flat) levels 5, 10, 15,..., 95 }
RevEngRSIArray[1]= RevEngRSI( Price, 2, 14 ) ;
RevEngRSIArray[2]= RevEngRSI( Price, 4, 14 ) ;
RevEngRSIArray[3]= RevEngRSI( Price, 6, 14 ) ;
RevEngRSIArray[4]= RevEngRSI( Price, 8, 14 ) ;
RevEngRSIArray[5]= RevEngRSI( Price, 10, 14 ) ;
RevEngRSIArray[6]= RevEngRSI( Price, 12, 14 ) ;
RevEngRSIArray[7]= RevEngRSI( Price, 14, 14 ) ;
RevEngRSIArray[8]= RevEngRSI( Price, 16, 14 ) ;
RevEngRSIArray[9]= RevEngRSI( Price, 18, 14 ) ;
RevEngRSIArray[10]= RevEngRSI( Price, 20, 14 ) ;
RevEngRSIArray[11]= RevEngRSI( Price, 22, 14 ) ;
Editor's note: The rest of the code has been left out here
for space. The code in its entirety can be found at Traders.com or TradeStationWorld.com.
--Mark MillsGO BACK
MarkM@TSSec at www.TradeStationWorld.com
EasyLanguage Questions Forum
TradeStation Securities, Inc.
A subsidiary of TradeStation Group, Inc.
![]() WEALTH-LAB: DECOMPOSITION METHOD
WEALTH-LAB: DECOMPOSITION METHOD
Last year, we created a RevEngRsi custom indicator based on Giorgos Siligardos' 2003 articles to allow any price series as an input. This month, we can concentrate on automating part of the decomposition method. As Siligardos admits in his article, "The method is extremely time-consuming." Time notwithstanding, it has a well-defined procedure and consequently can be expressed in WealthScript. We completed a portion of the task by locating peaks and troughs in the Rsi_L indicator and then translating these to price supports using RevEngRsi for potential BuyAtLimit signals. The code locates these on the chart as small circles (Figure 2).

Figure 2: Wealth-lab, Decomposition Method. For reference, plots of the RevEngRSI (dashed lines) indicator using the RSI values from Giorgos Siligardos' article are well-correlated with the script's automatic detection of these values. We also included code to show when the peak and troughs were actually detected in RSI_L.
One of our tenets while designing the code was that RSI support
levels far in the past have less and less significance. Therefore, we experimented
with the idea of assigning a "figure of merit" to RevEngRsi support values
based on the proximity of the first detection of the peak/trough to the
current bar. As time progresses, the merit of the support wanes, which
is visually expressed by the circle color going from bright red to black
and eventually being removed. A suggested improvement might be to detect
and average RSI support values for reverse engineering and further correlate
these with actual price supports. The final result can be assigned a cumulative
merit to use as a definitive level for limit buy signals.
WealthScript code:
{$I 'RevEngRSI'}
const Period = 14;
var PTLst, SupportLst: TList;
var Bar, StartBar, iRSI, ConstraintRSI,
  reL, reL2, TrBar, PkBar, TrBarPrev,
  PkBarPrev, RSIPane, RSI_L, Merit: integer;
var f, Lmt: float;
{ Highlights the peaks and troughs, and shows bar detected }
procedure MarkPeakTrough( Bar, PTBar, Pane, Color: integer; Val: float );
begin
  DrawCircle( 5, Pane, PTBar, Val, Color, #Thick );
  DrawLine( PTBar, Val, Bar, Val, Pane, Color, #Thin );
  DrawLine( Bar, Val-1, Bar, Val+1, Pane, Color, #Thin );
end;
procedure SortRSIPksAndTrghs( Bar: integer );
begin
var i, FirstBar, ptBar: integer;
{ Remove peaks and troughs outside of constrained period }
  PTLst.SortNumeric;
  FirstBar := Bar - ConstraintRSI;
  for i := PTLst.Count - 1 downto 0 do
    if PTLst.Item( i ) < FirstBar then
      PTLst.Delete( i );
{ Calculate the RevEngRSI based on an integer 'estimate' of the RSI peak/trough }
  SupportLst := TList.Create;
  for i := 0 to PTLst.Count - 1 do
  begin
    ptBar := PTLst.Item( i );
    iRSI := Trunc( @RSI_L[ptBar] );
    if iRSI < @RSI_L[Bar] then  // it's support
    begin
      f := RevEngRSI( Bar, #Low, Period, iRSI );
    { Assign a 'Figure of Merit' based on time proximity }
      Merit := Trunc( Min( 9, ConstraintRSI Div ( Bar - ptBar ) ) );
      SupportLst.AddData( f, Merit * 100 );
    end;
  end;
{ Plot the RevEngRSI support values as limit-buy circles }
  SupportLst.SortNumeric;
  for i := SupportLst.Count - 1 downto 0 do
  begin
    Merit := SupportLst.Data( i );
    Lmt := SupportLst.Item( i );
    if Bar = BarCount - 1 then
      BuyAtLimit( Bar + 1, Lmt, 'Merit ' + IntToStr( Merit ) )
    else
      DrawCircle( 4, 0, Bar + 1, Lmt, Merit, #Thin );
  end;
end;
PTLst := TList.Create;
RSI_L := RSISeries( #Low, 14 );
RSIPane := CreatePane( 100, false, true );
PlotSeriesLabel( RSI_L, RSIPane, 0, #Thin, 'RSI_L=RSI(#Low,14)' );
HideVolume;
{ Init peak/trough bars }
SetPeakTroughMode( #AsPoint );
ConstraintRSI := 4 * Period;
TrBarPrev := TroughBar( ConstraintRSI - 1, RSI_L, 6 );
PkBarPrev := PeakBar( ConstraintRSI - 1, RSI_L, 6 );
for Bar := ConstraintRSI to BarCount - 1 do
begin
  TrBar := TroughBar( Bar, RSI_L, 6 );
  PkBar := PeakBar( Bar, RSI_L, 6 );
  if ( TrBar <> TrBarPrev ) and ( TrBar > -1 ) then
  begin
    MarkPeakTrough( Bar, TrBar, RSIPane, #Red, @RSI_L[TrBar] );
    TrBarPrev := TrBar;
    PTLst.Add( TrBar );
  end;
  if ( PkBar <> PkBarPrev ) and ( PkBar > -1 ) then
  begin
    MarkPeakTrough( Bar, PkBar, RSIPane, #Blue, @RSI_L[PkBar] );
    PkBarPrev := PkBar;
    PTLst.Add( PkBar );
  end;
  SortRSIPksAndTrghs( Bar );
end;
{ Reference plots from article; shifted one bar forward }
reL := OffsetSeries( RevEngRSISeries( #Low, Period, 55.9 ), -1 );
reL2 := OffsetSeries( RevEngRSISeries( #Low, Period, 49.0 ), -1 );
PlotSeriesLabel( reL, 0, #Red, #Dotted, 'RevEngRSI_L(14,55.9)' );
PlotSeriesLabel( reL2, 0, #Green, #Dotted, 'RevEngRSI_L(14,49.0)' );
--Robert Sucher
www.wealth-lab.com
![]() AMIBROKER: DECOMPOSITION METHOD
AMIBROKER: DECOMPOSITION METHOD
In "The Decomposition Method," Giorgos Siligardos shows how to apply his reverse RSI technique described in his earlier articles ("Reverse Engineering RSI," June 2003, and "Reverse Engineering Rsi (II)," August 2003) to different price fields.
AmiBroker's own programming language provides an RSIa function that allows us to calculate RSI on any other price field. It also makes it easy to define our own RevRsi function that can be used as any other built-in function would be used.
The code in Listing 1 allows us to plot RSI and RevRsi based on any price field. The user can choose which chart to display by clicking the right mouse button over the chart pane, choosing the "Parameters" menu item, and then adjusting the values using the slider controls. All parameter changes are applied immediately, providing instant visual feedback. A sample chart can be seen in Figure 3.

Figure 3: AmiBroker, RevEngRSIH. This AmiBroker screenshot shows a weekly chart of the CIEN H indicator and the RevEngRSIH at 61 in the upper pane. The lower pane shows the RSIH indicator.
LISTING 1
WildPer = Param("Wilder Time Periods", 14, 1, 100, 1 );
Value = Param("RSI value", 50, 1, 100, 0.1 );
Field =  Param("Price Field (0-close, 1-high, 2-low)", 0, 0, 2, 1 );
Mode = Param("Mode (0-RSI, 1-ReverseRSI)", 1, 0, 1, 1 );
function RevRSI( value, array, periods )
{
   AU = Wilders( Max( array - Ref( array, -1 ), 0 ), periods );
   AD = Wilders( Max( Ref( array, -1 ) - array, 0 ), periods );
   x = ( periods - 1 ) * ( AD * value / (100 - value) - AU);
   return IIf( x >= 0, array+x, array + x * (100 - value)/value );
}
array = IIf( Field == 0, Close, IIf( Field == 1, High, Low ) );
aname = WriteIf( Field == 0, "Close", WriteIf( Field == 1, "High", "Low" ) );
if( Mode == 0 ) /* RSI */
{
   Plot( RSIa( array, WildPer ), "RSI( " + aname + ", " + WildPer + ")", colorRed );
}
else
{
   Plot( array, aname, colorBlack );
   Plot( RevRSI( value, array, WildPer ), "ReverseRSI( " + aname + ", " + WildPer + ")", colorBlue, styleThick );
}
--Tomasz Janeczko, AmiBroker.com
www.amibroker.com
![]() eSIGNAL: DECOMPOSITION METHOD
eSIGNAL: DECOMPOSITION METHOD
This eSignal code is based on "The Decomposition Method" by Giorgos Siligardos in this issue.

Figure 4: eSignal, Decomposition Method. Here is a demonstration of the RSIL indicator on CIEN.
/*****************************************************************
Provided By : eSignal. (c) Copyright 2004
Study:      The Decomposition Method by Giorgos Siligardos, Ph.D.
Version:  1.0
7/9/2004
Notes:
This formula may be applied multiple times to an advanced chart to
display multiple RevEngRSI, RevEngRSIL, or RevEngRSIH indicators by
selecting the price source for each instance separately.
Formula Parameters:       Default:
RSI1                                 50
K Periods                         14
Price Source                    Close
Color                                Color.red
*****************************************************************/
function preMain() {
    setPriceStudy(true);
    setStudyTitle("Reverse Engineering RSI ");
    setCursorLabelName("RevEngRSI");
    setDefaultBarFgColor(Color.red);
    setDefaultBarThickness(2);
    setShowTitleParameters(false);

    var fp1 = new FunctionParameter("RSI1", FunctionParameter.NUMBER);
    fp1.setName("RSI1");
    fp1.setLowerLimit(0);
    fp1.setDefault(50);

    var fp2 = new FunctionParameter("K", FunctionParameter.NUMBER);
    fp2.setName("K Periods");
    fp2.setLowerLimit(0);
    fp2.setDefault(14);
    var fp3 = new FunctionParameter("sSource", FunctionParameter.STRING);
    fp3.setName("Price Source");
    fp3.addOption("High");
    fp3.addOption("Low");
    fp3.addOption("Close");
    fp3.setDefault("Close");
    var fp4 = new FunctionParameter("cColor", FunctionParameter.COLOR);
    fp4.setName("Color");
    fp4.setDefault(Color.red);
}
var AUC = null;
var ADC = null;
var AUC_1 = 0;
var ADC_1 = 0;
var ExpPer = null;
var bEdit = true;
function main(RSI1, K, sSource, cColor) {
    if (RSI1 == null) RSI1 = 50;
    if (K == null) K = 14;

    if (ExpPer == null) ExpPer = (2*K) - 1;
    if (bEdit == true) {
        if (sSource == "High") {
            setCursorLabelName("RevEngRSIH");
            setStudyTitle("Reverse Engineering RSIH at "+RSI1);
        }
        if (sSource == "Low") {
            setCursorLabelName("RevEngRSIL");
            setStudyTitle("Reverse Engineering RSIL at "+RSI1);
        }
        if (sSource == "Close") {
            setStudyTitle("Reverse Engineering RSI at "+RSI1);
        }
        setDefaultBarFgColor(cColor);
    }

    if (getBarState() == BARSTATE_NEWBAR) {
        if (AUC != null) AUC_1 = AUC;
        if (ADC != null) ADC_1 = ADC;
    }

    if (sSource == "Close") {
        var p = close()
        var p1 = close(-1);
    } else if (sSource == "High") {
        var p = high()
        var p1 = high(-1);
    } else if (sSource == "Low") {
        var p = low()
        var p1 = low(-1);
    }
    if (p1 == null) return;

    if (p > p1) {
        AUC = ((1/K) * (p-p1)) + ( ((K-1)/K) * AUC_1);
    } else {
        AUC = ( ((K-1)/K) * AUC_1);
    }

    if (p1 > p) {
        ADC = ((1/K) * (p1-p)) + ( ((K-1)/K) * ADC_1);
    } else {
        ADC = ( ((K-1)/K) * ADC_1);
    }

    var x = (K - 1) * (ADC * (RSI1/(100 - RSI1)) - AUC);

    if (x >= 0) {
        var RevEngRSI = p + x;
    } else {
        var RevEngRSI = p + x * ((100 - RSI1)/RSI1);
    }

    return RevEngRSI;
}
--Jason Keck
eSignal, a division of Interactive Data Corp.
800 815-8256, www.esignalcentral.com
![]() PROPHET.NET: DECOMPOSITION METHOD
PROPHET.NET: DECOMPOSITION METHOD
The decomposition method described by Giorgos Siligardos in his article in this issue is available on the Prophet.Net website (https://www.Prophet.net) to all premium members. No coding is required on the part of the user. The indicator is built into the JavaCharts applet.
There are two indicators in JavaCharts based on the Siligardos article: RSI reverse (which is useful for determining support and resistance zones), and Rsix, which permits the application of high, low, or close values as the basis for the RSI study. For one-click access to these indicators, go to JavaCharts from your computer's browser:
https://www.prophet.net/analyze/javacharts.jsp
or click the "Analyze" tab at the Prophet.net website, then click the JavaCharts selection (Figure 5).
![]()
Figure 5: Prophet, Navigation. For one-click access to the indicators, click the "Analyze" tab at the Prophet.net website, then click the JavaCharts selection.
Click on the Tools menu (which you can also access by right-clicking
anywhere on a chart) and choose "Apply studies" from the Studies menu item.
The list of available studies (approximately 150 of them, shown in alphabetical
order) is in the second dropdown menu; you can choose RSI reverse or Rsix
from this list. You may also adjust the parameters for this study if you
desire (Figure 6).
Figure 6: Prophet, Studies Menu. Choose RSI reverse or Rsix from the list of available indicators. You can adjust the parameters if you desire. For the RSI reverse indicator, you can change the parameter in the Price field to denote whether you want to base the study on high, low, or closing prices. The Wilder period and RSI value parameters provide default values but can also be changed.
When using RSI reverse, for example, there are three parameters
you can change. The first, Price, is a single character denoting which
price you want to use as the basis for the study (H for high, L for low,
or C for close). The next two values, Wilder period and RSI value, are
numeric. All of these fields provide default values, so you don't need
to change anything unless you want to do so.
In the example shown in Figure 7, Intel's steady rise during the market bubble in the late 1990s is tracked by two RSI reverse indicators (whose parameters and last values are shown in the upper-left portion of the chart). The blue RSI level suggests the support level for the stock which, in spite of the collapse of the market that commenced in March 2000, held true for a full six months after the bubble started bursting.

Figure 7: Prophet, Decomposition Method. In this sample chart, Intel's steady rise during the market bubble in the late 1990s is tracked by two RSI reverse indicators (whose parameters and last values are shown in the upper-left portion of the chart). The blue RSI level suggests the support level for the stock which, in spite of the collapse of the market that commenced in March 2000, held true for a full six months after the bubble started bursting.
To get full access to the JavaCharts study set requires a premium
membership at Prophet. Premium memberships at Prophet.Net start at $14.95
per month; real-time market data is available for equities, options, and
futures. A free trial is available from https://www.prophet.net/tasc.
--Tim KnightGO BACK
Prophet Financial Systems, Inc.
www.Prophet.net
![]() AIQ: DECOMPOSITION METHOD
AIQ: DECOMPOSITION METHOD
This AIQ code is based on "The Decomposition Method" by Giorgos Siligardos. A sample chart is shown in Figure 8.

Figure 8: AIQ, CIEN Weekly. Here's a sample AIQ chart showing the RSIL and reverse-engineered RSI indicator based on Giorgos Siligardos' decomposition method.
!! WILDER RSI USING CLOSE,LOW & HIGH
!! REVERSE ENGINEERED RSIC, RSIL & RSIH
!  Based on article, "The Decomposition Method", by Giorgos Siligardos, Ph.D.
!  Coded by Richard Denning, 7/13/04
!To convert Wilder Averaging to Exponential Averaging use this formula:
 !ExponentialPeriods = 2 * WilderPeriod - 1.
! Wilder RSI based on closing price:
 eps is 0.000000001.
 Uc  is [close]-val([close],1).
 Dc  is val([close],1)-[close].
 W1 is 14.
 L1 is 2 * W1 - 1.
 AUC  is ExpAvg(iff(Uc>0,Uc,0),L1).
 ADC  is ExpAvg(iff(Dc>=0,Dc,0),L1).
 RSIC  is (AUC+eps)/(AUC+ADC+eps)*100.
! RSI using the low substituted for the close:
 UL is [low]-val([low],1).
 DL  is val([low],1)-[low].
 W2 is 14.
 L2 is 2 * W2 - 1.
 AUL  is ExpAvg(iff(UL>0,UL,0),L2).
 ADL  is ExpAvg(iff(DL>=0,DL,0),L2).
 RSIL  is (AUL+eps)/(AUL+ADL+eps)*100.
!RSI using the high substituted for the close:
 UH is [high]-val([high],1).
 DH is val([high],1)-[high].
 W3 is 14.
 L3 is 2 * W3 - 1.
 AUH  is ExpAvg(iff(UH>0,UH,0),L3).
 ADH  is ExpAvg(iff(DH>=0,DH,0),L3).
 RSIH  is (AUH+eps)/(AUH+ADH+eps)*100.
!Reverse Engineered RSIC:
 xC  is (W1-1)*(ADC*RSIC/(100-RSIC)-AUC).
 reRSIC  is iff(xC>0,[close]+xL,[close]+xL*(100-RSIC)/RSIC).
!Reverse Engineered RSIL:
 xL  is (W2-1)*(ADL*RSIL/(100-RSIL)-AUL).
 reRSIL  is iff(xL>0,[low]+xL,[low]+xL*(100-RSIL)/RSIL).
!!Reverse Engineered RSIH:
 xH  is (W3-1)*(ADH*RSIH/(100-RSIH)-AUH).
 reRSIH  is iff(xH>0,[high]+xH,[high]+xH*(100-RSIH)/RSIH).
!Report to show values of indicators:
 List if 1.
!Add rsiL, rsiH, reRSIL, & reRSIH as custom indicators to charts.
-- Richard Denning
www.aiq.com
![]() NEUROSHELL TRADER: DECOMPOSITION METHOD
NEUROSHELL TRADER: DECOMPOSITION METHOD
Giorgos Siligardos' decomposition method principally uses three indicators: the RSI, the reverse-engineered RSI, and horizontal support and resistance lines.
The RSI is a standard indicator in NeuroShell, found in the Price Momentum category.
Siligardos also makes use of horizontal lines, which may be inserted using the following procedure:
1. Select the Arithmetic Indicator category.
2. Select the Add2 Indicator. Add the desired value plus 0 to graph
a horizontal line on the chart.
The reverse-engineered RSI indicator can be created using NeuroShell Trader's ability to call external programs. These programs may be written in C, C++, Power Basic, and Delphi. We've created the reverse RSI custom indicator that you may download from NeuroShell Trader's free technical support website. (Note: This is the same indicator created for our Traders' Tip based on Siligardos' June 2003 article.)
After downloading the reverse-engineered RSI indicator, you can insert it by doing the following:
1. Select "New Indicator …" from the Insert menu.
2. Select the Custom Indicator category.
3. Select the Reverse RSI indicator.
4. Change the value of close to high, low, or close as appropriate
according to the article.
5. Select the future RSI value and Wilder time periods as the article
indicates.
We might suggest that the parameter future RSI value might be better determined by our genetic algorithm (GA) optimizer instead of the "eyeballing" method implied in the article. Simply insert buy and sell rules in a Trading Strategy for which the buy and sell levels are based on price proximity to, or crossovers of, the values of the reverse RSI indicator.
Users of NeuroShell Trader can go to the STOCKS & COMMODITIES section of the NeuroShell Trader free technical support website to download a copy of the charts we built, including the reverse RSI indicator (Figure 9).

Figure 9: NeuroShell Trader, Decomposition Method. Here's a sample chart in NeuroShell Trader displaying the reverse RSI, the RSI, and the horizontal support lines described in Giorgos Siligardos' article.
--Marge Sherald, Ward Systems Group, Inc.
301 662-7950, sales@wardsystems.com
www.neuroshell.com
![]() ASPEN GRAPHICS: DECOMPOSITION METHOD
ASPEN GRAPHICS: DECOMPOSITION METHOD
This code for use in Aspen Graphics is based on Giorgos Siligardos' article "The Decomposition Method." A sample chart is shown in Figure 10.
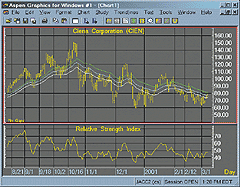
Figure 10: Aspen Graphics, Decomposition Method. Here are the CloseRevEng, HighRevEng, and LowRevEng in Aspen Graphics.
CloseRevEng(input,Periods=14,Value=50)={
 retval = nonum
 ExpPer = 2 * Periods - 1
 AvgUpClose = eavg(if($1.close > $1.close[1],$1.close-$1.close[1],0),ExpPer)
 AvgDnClose = eavg(if($1.close[1] > $1.close,$1.close[1]-$1.close,0),ExpPer)
 xResult = (Periods - 1)*(AvgDnClose * value/(100-value)- AvgUpClose)
 retval = if(xResult >= 0,$1.close + xResult,$1.close + (xResult*(100 - value)/value))
retval
}
HighRevEng(input,Periods=14,Value=50)={
 retval = nonum
 ExpPer = 2 * Periods - 1
 AvgUpHigh = eavg(if($1.high > $1.high[1],$1.High-$1.High[1],0),ExpPer)
 AvgDnHigh = eavg(if($1.high[1] > $1.high,$1.high[1]-$1.high,0),ExpPer)
 xResult = (Periods - 1)*(AvgDnHigh * value/(100-value)- AvgUpHigh)
 retval = if(xResult >= 0,$1.high + xResult,$1.high + (xResult*(100 - value)/value))
retval
}
LowRevEng(input,Periods=14,Value=50)={
 retval = nonum
 ExpPer = 2 * Periods - 1
 AvgUpLow = eavg(if($1.low > $1.low[1],$1.low-$1.low[1],0),ExpPer)
 AvgDnLow = eavg(if($1.low[1] > $1.low,$1.low[1]-$1.low,0),ExpPer)
 xResult = (Periods - 1)*(AvgDnLow * value/(100-value)- AvgUpLow)
 retval = if(xResult >= 0,$1.low + xResult,$1.low + (xResult*(100 - value)/value))
retval
}
--Andy Sewell
Aspen Research Group
support@aspenres.com
www.aspenresearch.com
![]() TRADINGSOLUTIONS: DECOMPOSITION METHOD
TRADINGSOLUTIONS: DECOMPOSITION METHOD
In his article "The Decomposition Method," Giorgos Siligardos reintroduces his reverse-engineered RSI function, which calculates the next price in a series based on a prediction or approximation of the next value of the RSI for that price.
This function can be implemented in TradingSolutions for use with any
price data using two functions, as follows:
Name: Reverse Engineered RSI Delta
Short Name: RevEngRSIDelta
Inputs: Value, Next RSI Value, EMA Time Periods
Formula:
Mult (Sub (Div (Add (EMA Time Periods,1),2),1),Sub (Div (Mult (EMA (Max (Negate
 (Change (Value,1)),0), EMA Time Periods), Next RSI Value),Sub (100,
 Next RSI Value)),EMA (Max (Change (Value,1),0), EMA Time Periods)))
Name: Reverse Engineered RSI
Short Name: RevEngRSI
Inputs: Value, Next RSI Value, EMA Time Periods
Formula:
If (GE (RevEngRSIDelta (Value, Next RSI Value, EMA Time Periods),0),Add (Value,
 RevEngRSIDelta (Value, Next RSI Value, EMA Time Periods)),Add (Value,
 Mult (RevEngRSIDelta (Value, Next RSI Value, EMA Time Periods),Div (Sub (100,
 Next RSI Value), Next RSI Value))))
The relative strength index (RSI) included with TradingSolutions
can also be used with any price data. It uses a simple moving average.
To replicate the RSI used in the article, an exponential moving average
can be used as follows:
Name: Relative Strength Index (Exponential)
Short Name: RSIE
Inputs: Value, EMA Time Periods
Formula:
Mult (Div (Add (EMA (If (Inc (Value),Change (Value,1),0),EMA Periods),0.0000000001),
 Add3 (EMA (If (Inc (Value),Change (Value,1),0),EMA Periods),EMA (If (Dec (Value),
 Negate (Change (Value,1)),0),EMA Periods),0.0000000001)),100)
In the case of all of these functions, "Ema time periods" is substituted
for "Wilder time periods." This value is (2*W-1). For example, for a Wilder
time period of 14, a value of ((2*14)-1) = 27 should be used.
The reverse-engineered RSI presents an alternative way to predict the next price in a series. Using the neural networks in TradingSolutions, a prediction of the next value of the relative strength index (RSI) could be created. That value could then be fed into the reverse-engineered RSI function to approximate the next value of the price. This prediction of the price could then be used in entry/exit systems or as an input to a model of the optimal signal.
These functions are available in a function file that can be downloaded from the TradingSolutions website in the Solution Library section.
--Gary Geniesse
NeuroDimension, Inc.
800 634-3327, 352 377-5144
www.tradingsolutions.com
![]() TECHNIFILTER PLUS: DECOMPOSITION METHOD
TECHNIFILTER PLUS: DECOMPOSITION METHOD
Here are the TechniFilter Plus formulas for the RsiL, RsiH, RevEngRsiL,
and RevEngRsiH based on "The Decomposition Method" by Giorgos Siligardos.
NAME: RSIH
SWITCHES: multiline
PARAMETERS: 14
FORMULA:
[1]: 2 * &1-1      {ExpPer}
[2]: 0.000000001  {eps}
[3]: (IF_THEN(H>Hy1,H-Hy1,0))X[1] {AUH Average up high}
[4]: (IF_THEN(HY1>H,HY1-H,0))X[1] {ADH Average Down high}
[5]: ([3]+[2])/([3]+[4]+[2])*100
NAME: RSIL
SWITCHES: multiline
PARAMETERS: 14
FORMULA:
[1]: 2 * &1-1      {ExpPer}
[2]: 0.000000001  {eps}
[3]: (IF_THEN(L>Ly1,L-Ly1,0))X[1] {AUL Average up low}
[4]: (IF_THEN(LY1>L,LY1-L,0))X[1] {ADL Average Down Low}
[5]: ([3]+[2])/([3]+[4]+[2])*100
NAME: RevEngRSIH
SWITCHES: multiline
PARAMETERS: 50,14
FORMULA:
[1]: 2 * &2-1      {ExpPer}
[2]: 0.000000001  {eps}
[3]: (IF_THEN(H>Hy1,H-Hy1,0))X[1] {AUH Average up high}
[4]: (IF_THEN(HY1>H,HY1-H,0))X[1] {ADH Average Down High}
[5]: (&2-1)*([4]*&1/(100-&1)-[3])  {x}
[6]: IF_Then([5]>=0, H+[5], H+[5]*(100-&1)/&1)
NAME: RevEngRSIL
SWITCHES: multiline
PARAMETERS: 50,14
FORMULA:
[1]: 2 * &2-1   {ExpPer}
[2]: 0.000000001  {eps}
[3]: (IF_THEN(L>Ly1,L-Ly1,0))X[1] {AUL Average up low}
[4]: (IF_THEN(LY1>L,LY1-L,0))X[1] {ADL Average Down Low}
[5]: (&2-1)*([4]*&1/(100-&1)-[3])  {x}
[6]: IF_Then([5]>=0, L+[5], L+[5]*(100-&1)/&1)
Visit the Technifilter Plus website to download these reports and
formulas. A sample chart is in Figure 11.
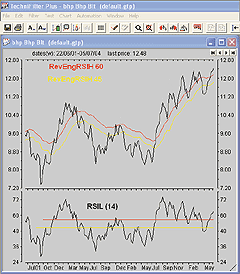
Figure 11: TechniFilter Plus, Decomposition Method. Here are Giorgos Siligardos' indicators as implemented in TechniFilter Plus.
--Benzie PikoosGO BACK
Brightspark, +61 8 9375-1178
sales@technifilter.com, www.technifilter.com
![]() NEOTICKER: DECOMPOSITION METHOD
NEOTICKER: DECOMPOSITION METHOD
In order to implement the concepts in Giorgos Siligardos' article in this issue, "The Decomposition Method," NeoTicker only needs to code one indicator: the reverse-engineered RSI (Listing 1), with two built-in indicators: Plot and RSI, even though the sample code shown in the article's sidebar gives separate code listings for each element.
Weekly low chart
To recreate a chart of Cien's weekly lows (Figure 12) as shown in Siligardos' article, add the weekly data series to a new chart in NeoTicker by selecting the data series, then applying the "Plot" indicator. At the Add Indicator window's Link tab, change the field selection to "Low." This makes the indicator plot the low values of the underlying data series as a line. Next, add the RSI indicator to the weekly data series. At the Add Indicator window's Link tab, change the field selection to "Low." NeoTicker returns RSI calculations based on the lows of the Cien weekly bars. Next, add the indicator "Constant 2 Lines" at the RSI low pane; set the two values to 55.9 and 49 to illustrate the upper and lower support levels of the RSI low indicator. Finally, add the two reverse-engineered RSI indicators. At the Link tab, set the Field selection to "Low," and set the period field to 55.9 and 49, correspondingly.
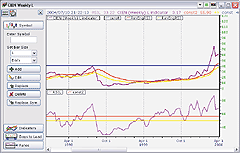
Figure 12: NeoTicker, CIEN Weekly Low Chart. This sample chart shows a line plot of the low values of the underlying data series; the RSI calculations based on low of the CIEN weekly bars; the indicator "Constant 2 Lines," illustrating the upper and lower support levels of the RSI low indicator; and the two reverse-engineered RSI indicators.
Weekly high chart
To recreate the CIEN weekly high chart (Figure 13) from Siligardos' article, first add the weekly data series to a new chart. Add the "Plot" indicator, but this time select "High" at the Add Indicator window's Link tab. This will show a line with all high values of the underlying data series. Next, add the RSI indicator to the weekly data series, and set the Link field to "High" at the Add Indicator window. This will result in RSI calculations based on high values of the weekly data series. Next, add the Constant 2 Lines indicator as two horizontal lines to show support levels for the RSI based on weekly highs. Finally, add the two reverse-engineered RSI indicators, set the Field selection to high to make the indicator calculation based on the highs, and at the parameter tab, set the period to 61 for the first one and 50 for the second.
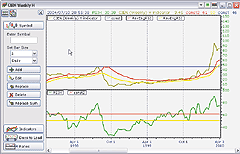
Figure 13: NeoTicker, CIEN Weekly High Chart. This sample chart shows a line plot of the high values of the underlying data series; the RSI calculations based on highs of the CIEN weekly bars; the indicator Constant 2 Lines, illustrating the upper and lower support levels of the RSI high indicator; and the two reverse-engineered RSI indicators.
Weekly close chart
To recreate the CIEN weekly closing price chart (Figure 14) as shown in Siligardos' article, first add the weekly data series to a new chart. At the Add Data window, change the Style selection to "Line," so a line showing only the weekly closing prices will plot. Next, add the RSI indicator. Since the default link for the indicator is for closing prices, no additional setting changes are required. Then add the 3 Constant Lines indicator to plot the three horizontal lines at support. Finally, add the three reverse-engineered indicators with the period value 60.2, 55.5, and 50.4.
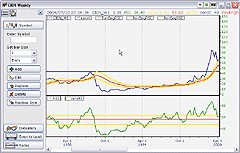
Figure 14: NeoTicker, CIEN Weekly Close Chart. This sample chart shows a line plot of weekly closing prices; the RSI indicator; the 3 Constant Lines indicator, which plots the three horizontal lines at support; and finally, the three reverse-engineered indicators with the period values of 60.2, 55.5, and 50.4.
Listing 1
$value := if(param1<1, 1, if(param1>100, 100, param1));
$WildPer := if(param2<1, 1, if(param1>100, 100, param2));
$ExpPer := 2*$WildPer-1;
'Average up data series
$AUDS := qc_xaverage(if(data1>data1(1), data1-data1(1), 0), $ExpPer);
'Average down data series
$ADDS := qc_xaverage(if(data1(1)>data1, data1(1)-data1, 0), $ExpPer);
$x := ($WildPer-1)*($ADDS*$value/(100-$value)-$AUDS);
plot1 := if($x>=0, data1+$x, data1+$x*(100-$value)/$value);
This code for the reverse-engineered RSI can be downloaded
from the NeoTicker Yahoo! user group as well as from the TickQuest website.
--Kenneth Yuen, TickQuest Inc.GO BACK
www.tickquest.com
![]() SMARTRADER: DECOMPOSITION METHOD
SMARTRADER: DECOMPOSITION METHOD
This month's Traders' Tip is based on the RevEngRsiH indicator described in "The Decomposition Method" by Giorgos Siligardos in this issue.
Here, we will only present the solution for reverse engineering the RsiH, since, as pointed out in the article, values for the low and close may be calculated by simple substitution of the appropriate price fields in the formulas.
Calculations for reverse engineering the RSI are fairly straightforward, albeit slightly challenging for the algebra-disadvantaged.
The SmarTrader specsheet for this method is shown in Figure 15. Row 9, value, is a coefficient where the test RsiH is input. Row 10, WildPer, is another coefficient containing the number of periods for the RSI calculation. Row 11, ExpPer, is a user formula row. Row 12, upDiff, determines the difference of the current and previous High as a setup for row 13, up, which is an if statement to extract only the up changes. Rows 14 and 15, dnDiff and dn, determine the down changes.
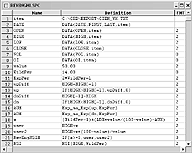
Figure 15: SmarTrader, Decomposition Method. Here is a specsheet for Siligardos' method.
Rows 16 and 17, Auh and Adh, are exponential moving averages of
the up and dn rows above, using the number of periods established by ExpPer.
Row 18, x, is a user formula row. Rows 19 and 20 are user formula rows
setting up row 21, an if statement, which determines the value of RevEngRsiH.
Row 22, RSI, is a regular RSI study based on the High price field.
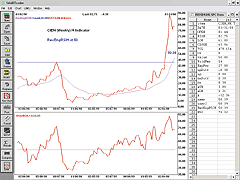
Figure 16: SmarTrader, Decomposition Method. Here is a sample chart of the decomposition method in SmarTrader. This chart shows the RevEngRSI high chart, but low or close could be substituted.
A copy of the specsheet can be downloaded from our website at www.stratagem1.com.
A sample chart is shown in Figure 16.
--Jim Ritter, Stratagem Software
800-779-7353 or 504-885-7353,
info@stratagem1.com, Stratagem1@aol.com
www.stratagem1.com
![]() FINANCIAL DATA CALCULATOR: DECOMPOSITION METHOD
FINANCIAL DATA CALCULATOR: DECOMPOSITION METHOD
The article "The Decomposition Method" by Giorgos Siligardos shows how to use the reverse-engineered RSI on high and low daily prices to show levels of support and resistance. We need two functions, RSI (already a part of FDC), and a new function we will call revengrsi.
To create revengrsi, open the macro wizard, choose "New macro," and
enter the following code into the definition window:
k  P:  #L
value:  #R
ch:  change P
per: (2*k) - 1
AU: per expave pos ch
AD: per expave abs neg ch
X: (k - 1) * (AD * value / (100 - value)) - AU
rev1: P + X when X >= 0
rev2: P + ((X * (100 - value) / value) - AU) when X < 0
rev1 merge rev2
Save this macro under the name "revengrsi." The syntax for use is:
(k P) revengrsi value
where k is the basic period desired for Wilder's RSI, P is any single
column dataset, and value is the result of forming the dataset k Rsi P.
Thus, to produce what is called the RevEngRsiL in Siligardos' article,
you would enter the command:
(14 L) revengrsi value
where L is the daily low price for some commodity, and value is
14 RSI L. A similar result holds for RevEngRsiH, using the daily high price
H.
--Robert C. Busby, 856 857-9088GO BACK
Mathematical Investment Decisions Inc.
(formerly Futures Software Associates)
www.mathinvestdecisions.com
![]() BULLCHARTS: DECOMPOSITION METHOD
BULLCHARTS: DECOMPOSITION METHOD
In this issue, Giorgos Siligardos describes the decomposition method.
BullCharts' own built-in scripting language, BullScript, can be leveraged
to speed up the analysis process by combining indicators together.
[citation="Stocks & Commodities magazine, The Decomposition Method"]
p:=expression("Price Field");
WildPer:=input("Time Periods",14,1);
ExpPer:=2*WildPer-1;
{Average Up Low}
AUP:=ma(max(p-hist(p,1),0),ExpPer,E);
{Average Down Low}
ADP:=ma(max(hist(p,1)-p,0),ExpPer,E);
{Result}
AUP/(AUP+ADP)*100;
Listing 1 combines the functions of RSIH and RSIL. Use the "Price
Field" expression to prompt the user to select high, low, or close. This
saves time, as individual indicators do not need to be re-added to the
chart for each price field.
Use Listing 2 for the reverse-engineered RsiP. Similar to before, you only need to add this indicator once, then adjust the Price Field setting to perform your analysis on high, low, or close. The indicator also displays the appropriate price field.
Now things get interesting. The method that Siligardos describes involves determining a probable range of values. In his article, RsiL support levels are found for CIEN at 55.9 and 49. Enter these two values into the "1st Rsi level" and "2nd Rsi level" inputs (the order is not important). The BullCharts fill linestyle command at the end of the script will draw a translucent fill between the two lines, clearly highlighting the range of values that this price field may be expected to take (Figure 17).
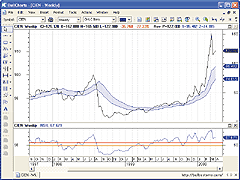
Figure 17: BullSystems, an analysis of the low price. The BullCharts fill style highlights the range of the reverse-engineered RSI for the two levels indicated in the second pane.
[citation="Stocks & Commodities magazine, The Decomposition Method"]
p:=expression("Price Field");
val1:=input("1st RSI Level",50,1);
val2:=input("2nd RSI Level",60,1);
WildPer:=input("Time Periods",14,1);
ExpPer:=2*WildPer-1;
{Average Up and Down}
AUP:=ma(max(p-hist(p,1),0),ExpPer,E);
ADP:=ma(max(hist(p,1)-p,0),ExpPer,E);
x1:=(WildPer-1)*(ADP*val1/(100-val1)-AUP);
x2:=(WildPer-1)*(ADP*val2/(100-val2)-AUP);
RevEng1:=p+x1*if(x1>=0,1,(100-val1)/val1);
RevEng2:=p+x2*if(x2>=0,1,(100-val2)/val2);
{Show Results}
[name=Price Field; color=Black]
p;
[color=Blue]
[name=1st RevEng RSIP]
RevEng1;
[name=2nd RevEng RSIP]
RevEng2;
[name=RSIP Ribbon; linestyle=Fill]
RevEng1; RevEng2;
--Peter Aylett, BullSystemsGO BACK
www.bullsystems.com
All rights reserved. © Copyright 2004, Technical Analysis, Inc.
Return to September 2004 Contents
