Traders Of Paradise
Rotten Apples? Spotting Adam And Eve Double Tops
by Thomas N. Bulkowski
These variations on the classic double top have performance differences. You can profit from them. Here's how.
Recognizing a budding double top is the first step to averting disaster. Trading them properly can save you from taking a loss -- it may even make you a tidy sum. Ignoring them could hurt your wallet. What is a double top, and what do Adam and Eve have to do with it? In early 2003, the market started trending upward. By January 2004, stocks began to get pricey, and I was expecting double tops to appear like daffodils in the spring.
A double top looks just like it sounds: a twin price peak with highs near the same price level and peaks separated by several weeks (some recommend they be at least a month apart). It forms at the end of an upward price trend, although the trend need not be very long. The dip between the two peaks is usually 10% to 20%, sometimes much more. I have found that the deeper the valley, the better the pattern's performance.
Adam and Eve refer to the shape of the tops. I am sure you can guess what they look like, but I will spell it out anyway. Adam tops are narrow and pointed, perhaps with a one-day spike. Eve tops are more rounded, wider, and sometimes have many peaks near the same price.
ADAM & ADAM
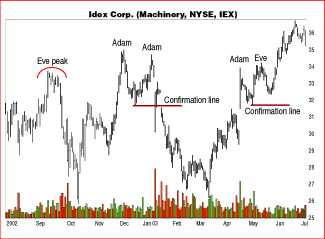
Figure 1 shows an example of an Adam & Adam double top. The twin peaks are a month apart, so they are distinct minor highs. The valley between them drops 10%. Most important, both peaks look narrow and pointed -- similar in shape to one another. Contrast the Adam peaks with the Eve peak in September.
When you are trying to assign Adam and Eve labels to your double tops, look at nearby peaks for guidance. The Adam & Eve top in April-May is an example. The Adam top is a one-day spike, but the Eve top is rounder and fatter. This Adam & Eve top is not a valid double top. Do you know why? The answer is confirmation. Price does not close below the valley low. In the Adam & Adam pattern, price gaps below the confirmation line, turning the twin-peak formation into a true double top.
Among the four varieties of double tops, the Adam & Adam pattern is a strong performer. In the 134 Adam & Adam patterns I looked at, the average decline below the confirmation line was 18%. Volume is usually highest on the left peak (60% of the time).

Figure 1: Adam & Adam double top. Twin narrow peaks make up this Adam & Adam double top. The April Adam & Eve pattern is not a double top, because price stays above the low between the two peaks.
...Continued in the November issue of Technical Analysis of STOCKS & COMMODITIES
Excerpted from an article originally published in the November 2004 issue of Technical Analysis of STOCKS & COMMODITIES magazine. All rights reserved. © Copyright 2004, Technical Analysis, Inc.
Return to November 2004 Contents