Tricks Of Trading
Selecting Top Performers
by Jongseon Kim
Too often we enter a trade only to find that the stock price just isn't going anywhere. Here's how you can avoid falling into this trap.
When should you trade and when should you not? I answered that question in my article, "Trading In Tempo With TRIX." The next hurdle before entering a trade is to select stocks that will give you the best rate of return. If you choose a stock that is slow-moving, you are bound to be disappointed, because even in a strong market these stocks will give you a low rate of return. You don't want to choose the wrong one.
SELECTING THE RIGHT STOCKS
Naturally, you would like to accumulate a high rate of return, and in order to do so, you must earn as much as possible while you are in your trades. In this article, I will discuss several methods for selecting the most promising, best-performing stocks.
In Figures 1 and 2, I reintroduce the basic concept of when and when not to trade from my earlier article. Now that you know when, how do you select the what?
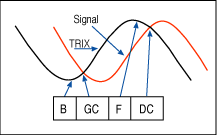
Figure 1: Trading with the TRIX. Here you see the bounce (B), golden cross (GC), fall (F), and dead cross (DC).
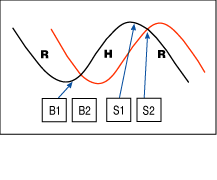
Figure 2: When to buy and when to sell. The principle behind deciding when to buy and sell has to do with the crossover of the TRIX and signal lines.
The essential factor to consider is the momentum of the rise in stock price. You need to select stocks that show strong momentum, or the potential for strong momentum. Only then will the buy and sell signals provide a satisfactory rate of return (Figure 2). If the momentum is not strong, you may experience a situation similar to that in Figure 3. But how do you know which stocks have momentum, activity, or potential?
To find out, I analyzed four methods. In the first three, I used the
TRIX indicator. In the fourth, I focused on avoiding sudden and undesired
fluctuations in the price of healthy stocks. To study and verify the momentum
and potential effect, I looked at the weekly chart of the Nasdaq Composite
from November 1995 to April 2004 (Figure 4). You can apply the studies
I discuss in this article to medium-term investments.
...Continued in the November issue of Technical Analysis of STOCKS & COMMODITIES
Excerpted from an article originally published in the November 2004 issue of Technical Analysis of STOCKS & COMMODITIES magazine. All rights reserved. © Copyright 2004, Technical Analysis, Inc.
Return to November 2004 Contents