Simple To Use, Powerful In Diagnosis
Candlestick Trading Principles
by Steve Nison, CMT
Candlestick charts are available almost everywhere. Are you using them to their fullest potential?
Until I wrote about the technique of Japanese candlestick charting in the 1980s, they were unknown in the Western world. Since then, candlesticks have become ubiquitous, available in almost every software and online charting package.
Why have candlestick charts become so popular? The answer is simple. When properly used, candlesticks let you seize trading opportunities by pinpointing early market turns and minimizing losses.
However, the Japanese say that "a wise hawk conceals its claws," and with the popularity of candles comes misuse. Too many of those applying candlesticks are using them incorrectly. With this in mind, I have designed 12 trading principles to help traders capitalize on candlestick charts by bolstering trading performance, decreasing market risk, and correcting the most common mistakes. I don't have enough room to address them all in this article, but I will address four of the 12.
TRADING PRINCIPLE 1
Candlesticks are easy to use but powerful in diagnosis
Since candlestick charts are now so accessible, why not learn how to
harness their potential? What good is it to have them around unless you
can use the insights they can provide?

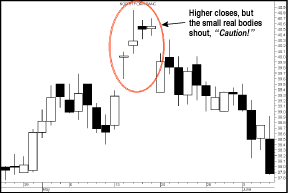
Figure 1: What is this candlestick chart saying? Even though the trend is up, the size of the candlestick bodies within the circled area indicate that the market is losing its breath.
Nonetheless, some technicians believe candlesticks are too complicated
or there are too many patterns to understand. Untrue. Candlesticks are
so easy to use and so powerful that once you learn even the basic concepts
you'll never go back to a bar chart. In addition, while there may be many
candlestick signals, there are only a dozen or so key signals and patterns.
I will explain how even a single significant candlestick can offer important
trading insights.
...Continued in the November issue of Technical Analysis of STOCKS & COMMODITIES
Excerpted from an article originally published in the November 2004 issue of Technical Analysis of STOCKS & COMMODITIES magazine. All rights reserved. © Copyright 2004, Technical Analysis, Inc.
Return to November 2004 Contents