Just when I think I have a system in place and have it all figured out, the market pulls a fast one on me. Just when everything is moving along in one direction, something will happen to cause everyone to reverse direction, and very quickly. Whenever I see this happening, I can't help but remember a phrase I once came across that I still consider to be a perfect description of the financial markets: "Market participants are like a school of fish that all change direction at the same time."
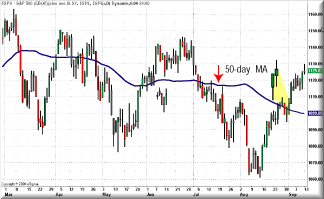
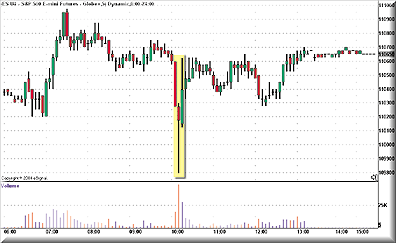
To give you an idea of how accurate that statement is, I am going to share a trade with you. It's not necessarily an example of a good trade, but of course, at the time I thought it was fabulous. On September 1, 2004, the daily chart of the Standard & Poor's 500 (Figure 1) showed that the index was hovering over the 50-day moving average. Judging by the reaction of prices to this moving average, I wasn't sure whether it would go up or down. But given that the moving average was sloping down, I decided that if I were to make a trade, it would be to short the emini if the opportunity arose. Sure enough, as you can see from the five-minute chart of the S&P emini (Figure 2), at 10:05 am (PT) there was a massive selloff, indicated by the surge in volume.

FIGURE 1: DAILY CHART OF THE S&P 500. Will prices stay above or go below the 50-day moving average?

FIGURE 2: FIVE-MINUTE CHART OF THE EMINI SEPTEMBER CONTRACTS. Just one trade sent traders scrambling to sell -- and it was all based on a mistake.
Typically, I would have waited about another hour before placing my first trade for the day, but emotions always rule, and my adrenaline started pumping when I saw this selloff begin. I guess I was at the right place at the right time, and this led me to enter a short position at 1105.00. Within minutes, I exited the position at 1102.25. Not bad for a day, I thought. If you read my column in the October 2004 issue, you know that two points is my objective when trading the S&P emini contracts.
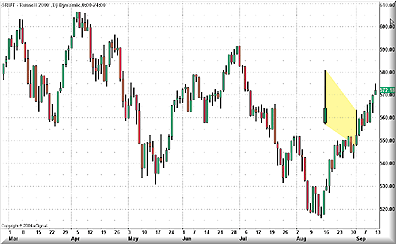
It wasn't until later that I found out the reason behind that sudden selloff. It had to do with someone placing a bad trade, and from the ensuing rush to sell or short positions, I assume that the trade was of significant size. Apparently, that trader had meant to buy shares in the Russell 2000, but instead sold them by mistake (Figure 3). That was enough to send other traders scrambling to sell, merely to follow suit -- just like a school of fish. Once the mistake was discovered, the markets resumed their original direction. As you can see from the five-minute chart in Figure 2, this all took place within a matter of a few minutes.

FIGURE 3: DAILY CHART OF THE RUSSELL 2000. This is where it all began, but the effects were felt throughout the markets.
In this trade, I just went with the flow and made my two points -- and just a little more. All I can say is it was a lucky trade, one that might not have ended up being lucky at all if I hadn't seen this drastic price movement in its early stages. Given the speed with which it all happened, I might not have been able to make a quick profit if I had waited and taken the position at the second bar.
The moral of this story? When you see all the fish change direction, just follow the crowd. Don't worry about trying to get in and out at the peaks and troughs.
--Jayanthi Gopalakrishnan, Editor
Originally published in the November 2004 issue of Technical Analysis of STOCKS & COMMODITIES magazine. All rights reserved. © Copyright 2004, Technical Analysis, Inc.
Return to November 2004 Contents