Buy Power, Sell Power
Trend Trigger Factor
by M.H. Pee
Whether you're trading short term or long term, the only way to make money in the market is to position yourself in the direction of the trend.
The markets are mostly random, but they do have a small trend component. It is this trend component that you should take advantage of if you want to make money in the markets. I don't mean you should buy at the bottom of a trend and sell at the top by predicting exactly when it will start and when it will end. What you should do is follow the trend and ride it along until you see weakness. The further the market moves from your entry price in your direction, the more you will make; the stronger the trend, the more opportunity you will have to make a larger profit.
DEFINITION
To keep you trading with the trend, I designed an indicator called the trend trigger factor (TTF) that will help you be long in an uptrend and short in a downtrend. This indicator allows you to follow the trend and capitalize on that rare nonrandom trend component of the markets.
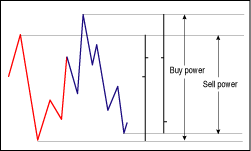
I will illustrate the calculation of the TTF by using a 15-day parameter. Before going any further, I will first define the TTF's signals: buy power and sell power. If you were to label today as day 1, yesterday as day 2, the day before yesterday as day 3, and so on, then the buy power and sell power are as follows:
15-day buy power = Highest high of (day 1 to day 15 inclusive) ? Lowest low of (day 16 to day 30 inclusive)

15-day sell power = Highest high of (day 16 to day 30) ? Lowest low of (day 1 to day 15)

After calculating these variables, you can move on to calculating the TTF:

15-day TTF = ((Buy power ? sell power)/(0.5*(Buy power + sell power))) * 100
The denominator of the TTF is actually the average range of two 15-day periods, in which the first period refers to day 1 through day 15 and the second period refers to day 16 through day 30, as shown below:
0.5*(Buy power + sell power)

= 0.5*((Highest high of first period ? Lowest low of second period) + (Highest high of second period ? Lowest low of first period))

= 0.5*((Highest high of first period ? Lowest low of first period) + (Highest high of second period ? Lowest low of second period))

= ((Range of first period) + (Range of second period))/2

= Average of the ranges in the first and second periods

FIGURE 1: SELL POWER AND BUY POWER IN A CONSOLIDATING MARKET. The buy power and sell power are of similar magnitudes.
...Continued in the December issue of Technical Analysis
of STOCKS & COMMODITIES
Excerpted from an article originally published in the December 2004 issue of Technical Analysis of STOCKS & COMMODITIES magazine. All rights reserved. © Copyright 2004, Technical Analysis, Inc.
Return to December 2004 Contents