GAPS
Are gaps to technical analysts what stock splits are to fundamental analysts: clear evidence of a market event, the significance of which is often inversely related to the level of glad surprise the event itself elicits? Thus, during the stock market bubble years of the late 1990s, television advertisements for brokerage firms would routinely feature "regular" guy (and gal) traders and investors babbling about how XYZ Trade Inc. kept them abreast of all the things a "serious trader/investor" needs: upgrades, downgrades, stock splits. ... In fact, a number of brokerages continue to present us with these alleged market players, who are apparently unable to execute a trade unless an analyst suggests they do so.
But technicians were often little better, as the birthright of stock market riches was claimed more and more often by an ever-widening cohort of stock traders and investors. And one of the favorite tools of the bubble-era technical analyst was the gap -- particularly the gap up. In a time when many of the most sought-after stocks were also the least-liquid stocks (especially as the Nasdaq market soared into its peak), the gap up appeared to become both more common and, potentially, more rewarding.
What exactly is meant by a gap? And do the different kinds of gaps -- from ex-dividend and common gaps to breakaway and exhaustion gaps -- suggest different things in terms of how the astute technical analyst reads them? Robert Edwards and John Magee, in their classic book Technical Analysis Of Stock Trends, write of gaps:
From the earliest days of stock charting, gaps attracted attention. These "holes" in the price trend graph were conspicuous. It was only natural that observers should attach importance to them, should try to assign some special significance to their occurrence. But the result was unfortunate, for there soon accumulated a welter of "rules" for their interpretation, some of which have acquired an almost religious force and are cited by the superficial chart reader with little understanding as to why they work when they work (and, of course, as is always the case with any superstition, an utter disregard for those instances where they don't work).It should be underscored that Edwards and Magee's contempt is not against gaps -- nor is it for the technical utility of gaps. They simply observe the tendency for certain concepts -- even in "objective" technical analysis -- to take on a sort of catechism among those who adhere to them. What follows is a brief but (I hope) helpful primer on what gaps are and when they mean what they mean.
In a later work, John Magee wrote of a number of different types of gaps that technical analysts might encounter when examining price charts. But what each of them had in common was the same thing he and Edwards wrote of years before:
A gap in the language of the chart technician represents a price range at which (at the time it occurred) no shares changed hands. This is a useful concept to keep in mind, because it helps to explain some of their technical consequences.What actually distinguishes gaps is less the gap itself and more the context in which it develops. So much is this the case that gaps are known by their environments. An obvious example of this is the uncommon and spectacular "island reversal gap." This is actually a pair of gaps -- one up and one down -- whose action creates a consolidation-range "island" above or below the gap area.Gaps on daily charts are produced when the lowest price at which a certain stock is traded on any one day is higher than the highest price at which it was traded on the preceding day.
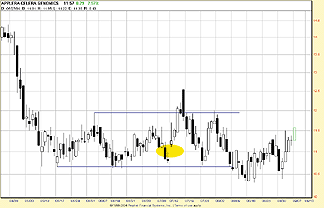
Common, area, or pattern gaps: Top on the list of gaps that Edwards and Magee would have chartists learn to ignore would most likely be common gaps (also known as area or pattern gaps). These gaps tend to occur in consolidation ranges, often as prices are nearing the support or resistance areas that act as boundaries. These gaps are more reactions to a microtrend inside an extended consolidation, rather than significant directional signals (see Figure 1). Magee writes:
The forecasting significance of Common or Pattern Gaps is practically nil. They have some use to the technician simply because they help him recognize an Area Pattern -- that is, their appearance implies that a Congestion formation is in process of construction.

FIGURE 1: COMMON. Here's an example of a common, or area, gap in shares of Applera-Celera Genomics.
Breakaway gaps: If common or area gaps are the bane of technical traders, then breakaway gaps represent the boon. This is because while both common and breakaway gaps tend to occur in or near consolidation patterns, it is the breakaway gap that signals the escape of prices from the meanderings of the trading range, and thus the opportunity for significant, directional price movement. Considering breakaway gaps, author Alexander Elder wrote in his book Trading For A Living that:
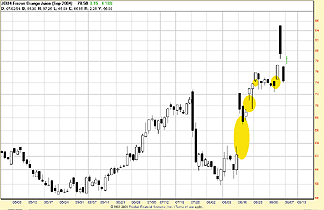
A breakaway gap can remain open for weeks, or months, and sometimes years. The longer the range that preceded the gap, the longer the subsequent trend. ... A breakaway gap marks a major change in mass mentality -- it reveals a great pressure behind the new trend. The sooner you jump aboard the new trend, the better.Continuation or runaway gaps: If common gaps are much ado about nothing, and breakaway gaps are a virtual jailbreak, then it wouldn't surprise me if continuation or runaway gaps cause the most consternation among traders. Why so? Well, when prices are in a dramatic move to the upside or downside -- so much so that opening prices are repeatedly higher than the previous session's high -- the resulting volatility is such that entry for new positions can be treacherous. After all, a market that can gap up two points in one session can gap down three points in the following session and still be very much in the midst of a strong bull move to the upside. However, even those who are in a position before the runaway gaps begin need to be wary of sharp reversals. Many of the traders enriched by an unexpected continuation gap up will soon be packing the exits in their zeal to get out with profits intact.
A number of commentators point out that continuation gaps tend to occur in the midst of a powerful trend. While this is true, just where "in the midst" actually is can be the difference between a strong gain and a painful gainer-becomes-loser. Magee goes so far as to suggest:
... A wide Gap is quite likely to appear at the time when the Runaway
is at its height, when quotations are moving most rapidly and easily with
region to the volume of transactions. That period comes normally at just
about the halfway point between the breakout which inaugurated the move
and the Reversal day or Congestion Pattern which calls an end to it.
Perhaps this is where the difference between "technical analyst"
and "technical trader" comes into play. Consider the chart of September
orange juice futures (Figure 2). As strong and sharp as this rally was
in late summer -- notwithstanding the likelihood of even further post-correction
gains -- all but the more long-term traders might have been cut up trying
to dodge the whirling blades of the volatile price action in August.

FIGURE 2: CONTINUATION. Runaway gaps abound in this chart of September orange juice futures.
Exhaustion gaps: Appropriately enough, the last type of gap discussed here is the exhaustion gap. The exhaustion gap -- next to perhaps the breakaway gap -- is the easiest to recognize, at least in hindsight. Exhaustion gaps might be known as "last gasps" (if you'll forgive the pun); rather than signaling momentum to come (as both breakaway and runaway gaps do), exhaustion gaps signal that momentum is coming to an end. Unfortunately, as Magee reminds us while talking about both continuation gaps and exhaustion gaps, "the first two of these are easily distinguished as to type by their location with respect to the preceding price pattern, but the last is not always immediately distinguishable [from] the second."
-- David Penn, Technical Writer
Learn more about gaps!
Bigalow, Stephen [2002]. "Dojis And Gaps," Working Money: June
18.
Bowman, Melanie F., and Thom Hartle [1990]. "Gaps," Technical Analysis
of STOCKS & COMMODITIES, Volume 8: December.
Bulkowski, Thomas [2003]. "Gauging Gaps," Technical Analysis of
STOCKS & COMMODITIES, Volume 21: September.
Crane, John [1991]. "Another Chance With Breakaway Gaps," Technical
Analysis of STOCKS & COMMODITIES, Volume 9: March.
Edwards, Robert D., and John Magee [2001]. Technical Analysis Of
Stock Trends, 8th ed., WHC Bassetti, ed. Saint Lucie Press.
Elder, Alexander [1993]. Trading For A Living, John Wiley &
Sons.
Luisi, Joe, and Jayanthi Gopalakrishnan [2000]. "What You Need to Know
About Gaps," Technical Analysis of STOCKS & COMMODITIES, Volume
18: September.
Magee, John [1994]. Analyzing Bar Charts For Profit, Dearborn
Financial Publishing.
Nice, Joe Van [1987]. "Gap Watching," Technical Analysis of
STOCKS & COMMODITIES, Volume 5: August.
Reverre, Stéphane [1999]. "Trading The Opening Gap," Technical
Analysis of STOCKS & COMMODITIES, Volume 17: November.
Sweeney, John [1991]. "Trading The Deutschemark's Gaps," Technical
Analysis of STOCKS & COMMODITIES, Volume 9: June.
Originally published in the December 2004 issue of Technical Analysis of STOCKS & COMMODITIES magazine. All rights reserved. © Copyright 2004, Technical Analysis, Inc.
Return to December 2004 Contents