Switching Funds Too Often? Here's Your Answer
A One Rank Screening Technique For Mutual Funds
In my earlier articles describing a "One Rank" (OR) switching methodology (see "Related read ing"), I emphasized that the switching rate (S/Y or S) was the driving parameter enhancing mutual fund returns and lowering risk. I also showed that S is a direct measure of a fund's persistence and could be used to screen equity type mutual funds for improved OR performance. Unfortunately, most funds cannot be switched at the high rates demanded by OR due to imposed restrictions by the various mutual fund suppliers. This restriction has been eliminated in the last few years by firms such as Rydex, Potomac, and ProFunds, as well as a new class of "low-cost" funds called exchange-traded funds (ETFS).Here's a momentum-following method using three technical analysis tools to help switch your mutual funds.
In this article, I propose a method that negates the need to switch a couple times a week, as in OR, by using a time-honored technical analysis approach utilizing momentum-following methods to switch. This results in only three to 12 switches per year. The three methods studied herein are: moving average convergence/divergence (Macd), made famous by Gerald Appel; stochastic (stoch.), pioneered by the late George Lane; and Accutrack (AT). These are all well-known in the technical analysis community, so I will not elaborate on the details.
SOME BACKGROUND FROM STATISTICS
In statistics, it is well known that the "runs test" (Z score) is used
to determine whether a series of values (or mutual fund returns) is random
and to what degree. The runs test is insufficient by itself to be definitive
as a measure of randomness because of the complex nature of studies of
random series. While studying the runs test, I realized that an approximation
of the Z score applied to a large series (greater than 100 terms) is directly
analogous to a formula I derived for offset correlation of a fund (Osc1).
You'll find this derivation in equation 7, sidebar Figure 1, of my article
"Serial Correlation Of One Rank" (Technical Analysis of Stocks & Commodities,
October 2003). That equation is:
Osc1 = 1 - Sr / S eq 1
Sr is the expected switching rate given by N*B(1-B), and S is
the actual switching rate. See the sidebar in this article for the approximate
derivation of the Z score ("Runs tests, Z score").

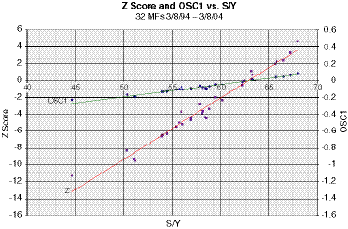
Figure 1: Z SCORE AND OSC 1 VS. S/Y. Here you see the resulting Z score and Osc1 results of the runs test for 32 equity funds from 3/8/94 to 3/8/04 both going to zero at an S/Y of 63.
In Figure 1 you see the resulting Z score and the Osc1 plotted against
S/Y (using Excel to get the results) for 32 equity funds taken from the
FastTrack (FT) database over a 10-year period. Both approaches result in
a linear (inverse) relationship over the S/Y range evaluated, with a co-incident
crossing of the zero x-axis at S = 63, an expected result. It is necessary
to further confirm that this S rate is, in fact, an excellent measure of
persistence that is as powerful as the runs test, or the less well-known
Osc1 results. This is important, since the S rate will be used as the mutual
fund screening technique for this article.
...Continued in the January issue of Technical Analysis of STOCKS & COMMODITIES
Excerpted from an article originally published in the January 2005 issue of Technical Analysis of STOCKS & COMMODITIES magazine. All rights reserved. © Copyright 2004, Technical Analysis, Inc.
Return to January 2005 Contents