Need A Dependable Pattern? Here's One
The Simple ABC Correction
by Thomas N. Bulkowski
An old joke says that if an investor buys land in an earthquake zone, it will be his own fault. When I see a simple ABC correction in a stock, it reminds me of pavement pushed up by an earthquake. The upward price trend shifts downward in a stair-step correction and then the price trend resumes its upward march, many times for an extended rally.This chart pattern reliably signals an extended move up. Take a look.
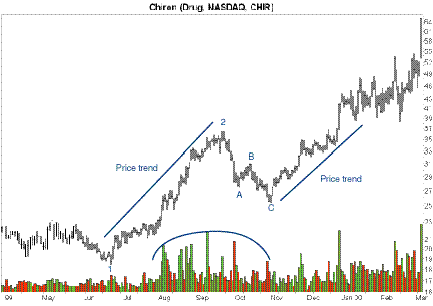
Figure 1 shows what I'm talking about. An upward price trend begins at point 1 and soars to point 2 before rounding over. Prices retrace a portion of the advance, forming the simple ABC correction. After meeting support at point C, prices resume their upward trend. This example shows a rounded volume appearance, the most common shape.
IDENTIFICATION: SEARCHING THE PAVEMENTFIGURE 1: A SIMPLE ABC CORRECTION. Note the dome-shaped volume.
What should you look for when searching for ABCs? Since this is a new pattern for me and I had little to go on, I made up my own set of rules to select patterns for statistical analysis. The essence of the ABC pattern is a measured move down (Mmd) chart pattern. In a Mmd, the drop from 2 to A is nearly the same as the drop from B to C. The ABC pattern does not have that restriction, but it does have others. Take a look at Figure 2.
Begin with point 1 (bottom left), the beginning of an upward move. In my definition, point 1 must be below point C, so the upward move is a strong one leading to ABC. Patterns that end below the trend start (below point 1) have a tendency to fail more often, meaning price continues down instead of making a large up move. The trend start marks a major turning point, from down to up or from flat to up. Point C in Figure 2, for example, also represents a major price turning point.
Next, look for a break in the price trend, the uneven pavement, or the step portion of a stair case climb. That is how you recognize the pattern most often: two price channels that do not align.
Within the connecting tissue of the two channels (2 to C), look for another trend break that looks like the ABC pattern. A, B, and C are all above 1, and are all below 2.
The low at C is always below the low at A, and point B is always above A. I also require that the ABC pattern be below peak 2. By that I mean no significant turning point should appear between 2 and A.
All of that may sound complicated, but it's not. I just needed some
rules to weed out potential patterns from a multitude of others, and those
are the ones I used in my search. The performance statistics justify the
choices.
...Continued in the January issue of Technical Analysis of STOCKS & COMMODITIES
Excerpted from an article originally published in the January 2005 issue of Technical Analysis of STOCKS & COMMODITIES magazine. All rights reserved. © Copyright 2004, Technical Analysis, Inc.
Return to January 2005 Contents