CHARTING THE MARKET
TRIANGLES
Writing about triangles as significant patterns in technical analysis, trader, author, and educator John Murphy observes that:
... The triangle is usually a continuation pattern. Its formation signals that a trend has gotten ahead of itself and needs to consolidate for a while. Once that consolidation has been completed, the prior trend usually resumes in the same direction. In an uptrend, therefore, a triangle is usually a bullish pattern. In a downtrend, a triangle is usually bearish.There is no fault to be found in Murphy's introduction to triangles. He goes on to note that there are two main varieties of generally "directional" triangles, outside of the basic symmetrical form. But one of the most interesting -- and potentially the most rewarding -- aspects of triangles is not included in his discussion.
Here is Elli Gifford, writing in her book, The Investor's Guide To Technical Analysis:
The triangle is reasonably uncommon as a reversal pattern. It is more often part of a trend, and its resolution signals continuation, but when it is a reversal pattern it is a powerful one. The rising lows and falling highs are evidence of a market argument tightening and, once it is resolved, the prediction -- made by measuring its base -- is usually fulfilled quickly.
While it is important to be able to spot patterns that have been
crafted well by the market, I sometimes think it might be even more important
to understand what a given technical pattern is saying about the underlying
market. In other words, a perfectly formed triangle is less important than
understanding that even if an imperfectly formed triangle appears to be
developing, that development is indicative of a certain kind of market
-- a market that can be exploited regardless of the pattern's perfection.
In the case of triangles, that "certain kind of market" is explained succinctly by another trader and trading educator, Alexander Elder:
A triangle is a congestion area whose upper and lower boundaries converge on the right. It can serve either as a reversal or, more often, as a continuation pattern. Some technicians call triangles coils. The market winds up and the energy of traders becomes compressed, ready to spring from a triangle.This "coil" is what makes triangles such exciting technical affairs. Essentially, what takes place in triangles is a compression of the price range and a drop in volatility relative to previous or historical volatility. While it is true that the resolution of this compression can be lackluster, much like slowly releasing the air from a balloon, it is no less true that a great deal of force is often required to control this measured release of pressure. In the case of the tradable markets, for example, this force would be the presence of more or less equally aggressive buyers and sellers.
However, in the same way that physics warns us to be alert of the tendency of behavior to "revert to the mean," those tradable markets that were expressing significant volatility before a triangle compression or coil develops are likely to return to that level of significant volatility as soon as the pressure that has forced price action into compression is relieved. In the case of prices, the only way to relieve this pressure is for one side -- the buyers or the sellers -- to overwhelm the other.
Although there are "directional" triangles -- ascending triangles, which are often continuation patterns in uptrends, and descending triangles, which are often continuation patterns in downtrends -- some traders believe that most triangles are best treated as symmetrical until prices break free from the pair of converging trendlines that define them. In part, this is a matter of trading practicality. The coil effect of triangles suggests that even if the resolution is an upside breakout from a descending triangle or a downside breakdown from an ascending triangle, the ensuing move is often powerful (that is, tradable). This is to take away nothing from the power of directional triangles to anticipate higher or lower prices to come. But it should underscore the trader's maxim that it is better to be wealthy than right. Upon meeting a triangle in the middle of the road, let it move before you do.
And while we're in the middle of the road, let's take a look at a few triangles in action:
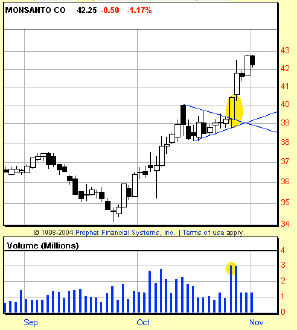
In Figure 1, consider the chart of Monsanto (MON). Here we have an almost picture-perfect symmetrical triangle acting as a continuation pattern in the stock's late-September-through-October rally. Note how MON slipped lower over the course of September, but then began moving up in the last few weeks of the month. Twelve days later, MON was up some five points before it slipped into a sideways correction that lasted a little over a trading week.

Figure 1: Continuation. An excellent example of a triangle acting as a continuation pattern appears in this uptrend in MON.
But this was more than a simple sideways correction; note how a
pair of converging trendlines bound the correction over the course of October.
This is the signature of a triangle pattern -- with the breakout on very
high volume on October 26 marking the pattern a thoroughly successful one.
The value of the width of the triangle at its broadest span, added to the
value at the breakout level, provides the best guide for a minimum upside
projection. In this case, a two-point triangle that broke out at about
39 provided a minimum upside of 41. As of this writing, MON was trading
near 421/4.
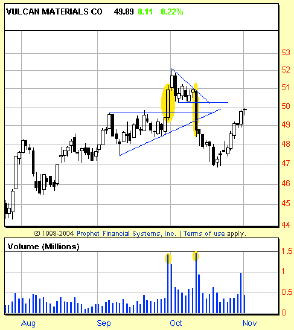
Another interesting example of triangles in action comes from the chart of Vulcan Materials (Vmc). Shares of Vulcan Materials (Figure 2) were moving higher going into the autumn of 2004. Then, in September, Vulcan Materials moved into a sideways consolidation characterized by a relatively steady, "flat" horizontal resistance trendline and an upward-sloping support trendline. This combination is the signature of an ascending triangle, generally a consolidation pattern in an uptrend. Given that Vmc was in an uptrend during the weeks leading into the triangle, an upside continuation was a sound bet to make on the near-term future of this stock.
And upside continuation was exactly what the market ordered as Vmc broke free from its triangle on explosive volume on September 30. Given the measurement rule mentioned previously -- that calls for adding the value at the widest point of the triangle to the value at the breakout point -- traders could have expected a minimum upside move of just over two points. As it happened, after breaking out at about 491/2, Vulcan Materials rallied to an intraday high just north of 52 before settling into a high close of about 513/4.
Figure 2: Breakout/Breakdown. In this chart of Vulcan Materials (VMC), a breakout from an ascending triangle runs straight into a descending triangle, with an equally powerful breakdown.
Then a funny thing happened. Just as the breakout from the ascending triangle petered out, Vmc appeared to have slipped into a descending triangle at the beginning of October. The descending triangle is, in many ways, the exact opposite of the ascending triangle; here, with the descending variety of triangle, there was a horizontal support trendline and a downward-sloping resistance trendline. The measurement rule for descenders is again the same as with the ascender; the value of the triangle measured at its widest part subtracted from the value at the breakout.
In the case of Vmc's descending triangle, a width value of about 11/2 subtracted from the value at the breakout of 501/4 gives a minimum downside of $48.75. Over the course of October, Vulcan Materials -- which incidentally broke down from its triangle with the same overpowering volume as accompanied the breakout from the previous ascending triangle -- fell to a closing low of about $47 by mid-month.
David Penn is Technical Writer for Stocks & Commodities.
Suggested reading
Elder, Alexander [1993]. Trading For A Living, John Wiley & Sons.
Gifford, Elli [1995]. The Investor's Guide To Technical Analysis: Predicting Price Action In The Market, Financial Times/Pitman Publishing.
Murphy, John J. [1996]. The Visual Investor, John Wiley & Sons.
Learn more about triangles!
Bulkowski, Thomas N. [1996]. "On Symmetrical Triangles," Technical
Analysis of Stocks & Commodities, Volume 14: October.
_____ [1996]. "Ascending And Descending Triangles," Technical Analysis
of Stocks & Commodities, Volume 14: November.
Evens, Stuart [1999]. "Triangles: Reversal Or Continuation," Technical
Analysis of Stocks & Commodities, Volume 17: January.
Hartle, Thom [2000]. "Triangles And Trends," Technical Analysis of
Stocks & Commodities, Volume 18: February.
Vomund, David [1998]. "Triangles," Technical Analysis of Stocks &
Commodities, Volume 16: July.
ýProphet Financial Systems
ýSee Editorial Resource Index
Excerpted from an article originally published in the January 2005 issue of Technical Analysis of STOCKS & COMMODITIES magazine. All rights reserved. © Copyright 2004, Technical Analysis, Inc.
Return to January 2005 Contents