Targeting Price Areas
The Truth About Volatility
Typically, volatility indicators are used to determine the direction, strength, and momentum of a security. The average true range (ATR), one of the more popular volatility indicators, measures volatility by looking at the average price ranges over the past x number of periods, taking gaps into account.Many indicators can help identify volatility. But can you use them to target specific price areas for entry signals, trailing stops, and profit-taking opportunities?
The true range indicator is the greatest of the following for each period:
- The distance from today's high to today's low
- The distance from yesterday's close to today's high
- The distance from yesterday's close to today's low.
Most trading software packages include ATR in their list of
indicators, which you can usually overlay on top of a bar chart, as can
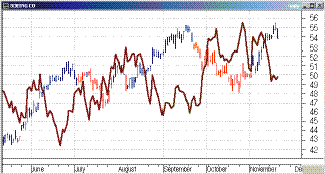
be seen in Figure 1.

FIGURE 1: POPULAR VOLATILITY INDICATOR. Here you see the average true range (ATR) overlaid on a price chart.
ANALYZE IT
Typically, when analyzing ATR volatility, you would focus on volatility at tops and bottoms and during price consolidation and retracements. However, if you incorporate the ATR into a few simple formulas, you may be able to identify where to enter and exit trades, and make a reasonable profit. Before going any further, I think it's fair to say that I apply my ATR volatility analysis only to securities that are in a rising trend. After all, it is the path of least resistance. Who wouldn't want to buy securities when they are rising and sell them when they are no longer in a rising trend?
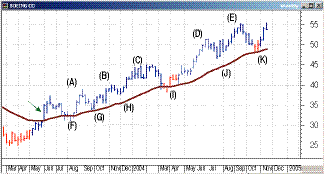
When is a security in a rising trend?
- When it is making higher highs and higher lows on a weekly chart
- When closing prices are above the 34-week moving average
- When the 34-week moving average is rising.

FIGURE 2: A SECURITY IN A RISING TREND. Price movement meets the criteria for a rising trend.
...Continued in the February issue of Technical Analysis
of STOCKS & COMMODITIES
Excerpted from an article originally published in the February 2005 issue of Technical Analysis of STOCKS & COMMODITIES magazine. All rights reserved. © Copyright 2005, Technical Analysis, Inc.
Return to February 2005 Contents