Trend Recognition And Breakout Alert
Directional Breakout Indicator
Despite the availability of more complex tools, moving averages remain one of the most popular methods that traders use to help identify price direction. Because they smooth data and reduce day-to-day price fluctuations, moving averages offer a rapid way to recognize bullish or bearish trends.Price breakouts of moving averages present many profitable trading opportunities. Here's an indicator you can use to detect breakouts and identify price direction.
Moving averages may also serve as points of support or resistance. As a result, price breakouts of a moving average alert traders to potential shifts in trend. The most familiar breakout occurs when the closing stock price crosses its moving average either to the upside or the downside, warning that a trend may be changing. That type of breakout often is accomplished with a single price bar.
Sometimes, however, a tug-of-war between bulls and bears causes the moving average to cut through two or more consecutive price bars. This results in brief sideways price action, a neutral zone, which sets up another type of breakout as price eventually emerges from the neutral zone either to the upside or downside.
Regardless of the type, price breakouts of moving averages present many profitable trading opportunities. Here is an indicator that detects both types of potential breakouts and identifies the direction that price might take following the breakout.
THE DIRECTIONAL BREAKOUT INDICATOR
According to conventional wisdom, the direction of the closing price in relation to its moving average at the time of the breakout forecasts subsequent price direction. When the closing price rises above the moving average, it portends a move to the upside. When the closing price falls from above to below the moving average, it warns that the price may continue to move to the downside. Even though reality often runs counter to conventional wisdom, there does seem to be enough truth in the predictive value of moving average breakouts to merit marking their occurrence.
The directional breakout indicator reveals each time that a portion of the price bar touches the moving average, regardless of where price closes. In addition, the indicator identifies price direction prior to, and immediately following, the breakout. This makes it easier to discern whether price moves that follow the breakout may be a continuation of trend or a reversal.

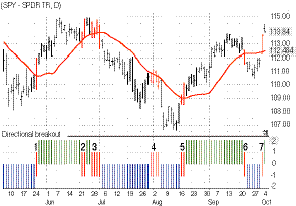
FIGURE 1: DAILY SPY WITH DIRECTIONAL BREAKOUT INDICATOR. The directional breakout indicator displays blue bars below the zero line when price is under the 20-period moving average and green bars above the zero line when price is above the moving average. The red bars on the indicator and the price bars call attention to potential breakout areas. To underscore the location of the red alert bars, a 20-period simple moving average has been plotted on price.
Figure 1 displays the directional breakout indicator with the daily
chart of the Standard & Poor's 500 exchange-traded fund (SPY) from
May to October 2004. In general, price direction is up when the indicator
rests above its zero line (green vertical lines) and down when the indicator
is below the zero line (blue vertical lines). To be considered directional,
price lows must be totally above the moving average in up moves and price
highs totally below the moving average in down moves.
The red indicator bars that cross the zero line identify those times when the moving average touches any portion of price. Those red bar alerts signal that a potential breakout is imminent. The red price bars on the chart correspond to the red indicator bars. For this article, I used a 20-period simple moving average throughout and plotted it on the price bars; however, the moving average of the indicator may be any length the trader chooses. (See the first sidebar, "eSignal code for directional breakout indicator.")
In Figure 1, the areas of potential breakouts are numbered from 1 through 7. During May, the blue indicator bars reflected the downward move in price. The red bar at point 1 suggested a shift in price action, as price pushed through its moving average. Price continued to rise and the bars of the directional breakout indicator turned to green.
Point 2 warned of another shift in price direction, which did not materialize
until point 3 when, after some testing of the moving average support, price
broke decisively to the downside. Price flirted with the moving average
at point 4 but continued its descent until point 5 before changing direction
to the upside. Then price entered a decline that was identified at point
6 but soon resumed its upward move after breaking out at point 7.
...Continued in the February issue of Technical Analysis of STOCKS & COMMODITIES
Excerpted from an article originally published in the February 2005 issue of Technical Analysis of STOCKS & COMMODITIES magazine. All rights reserved. © Copyright 2005, Technical Analysis, Inc.
Return to February 2005 Contents